Figure 3.
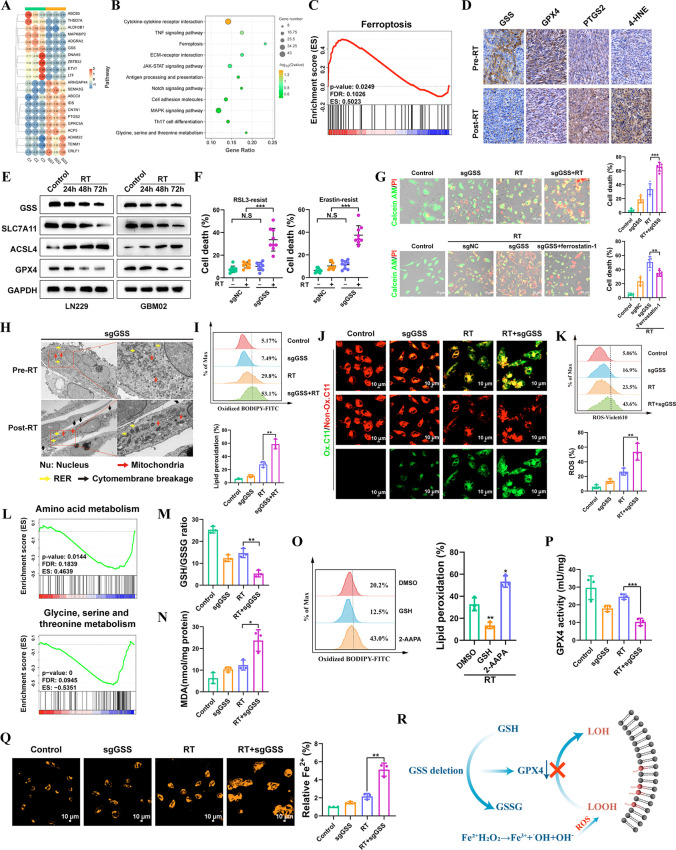
GSS contributes to GBM cell resistance to radiotherapy-induced ferroptosis. (A) Heatmap indicating the top 10 upregulated and downregulated genes between sgNC and sgGSS LN229 cells. (B) KEGG enrichment analysis of genes differentially expressed after GSS deletion. (C) GSEA demonstrating that ferroptosis-related genes were significantly enriched following GSS deletion. (D) Representative images of 4-HNE, PTGS2, GPX4, and GSS IHC staining of matched PDX GBM samples before and after radiotherapy. (E) Immunoblots analysis of ACSL4, SLC7A11, GPX4 and GSS expression in LN229 and GBM02 cell lines at 24, 48, and 72 h after exposure to 12 Gy of RT. (F) The effect of GSS deletion on RSL3/Erastin-resistant LN229 cells. (G) Detection of living and dead cells. (H) TEM images of LN229 cells (GSS deletion) with or without RT. Nu, nucleus; red arrows, mitochondria; yellow arrows, autophagosomes; black arrows, necrosis-related vacuoles. (I) The ratio of oxidized to nonoxidized lipids. (J) Confocal microscopy visualized the alterations in lipid peroxidation in LN229 cells after C11-BODIPY probe staining. Scale bar = 10 μm. (K) Liperfluo staining visualized lipid ROS in cells after treatment. (L) GSEA analysis of differentially abundant metabolites identified in GSS deletion LN229 cells. (M) The glutathione (GSH)-to-oxidized glutathione (GSSG) ratio was detected by flow cytometry. (N) The expression level of lipid peroxidation products (MDA). (O) The ratio of oxidized to nonoxidized lipids was assessed by flow cytometry. (P) Detection the activity of GPX4. (Q) The level of intracellular ferrous ions (Fe2+) was measured by FerroOrange probes. Scale bar = 10 μm. (R) Mechanism Diagram of GSS.

