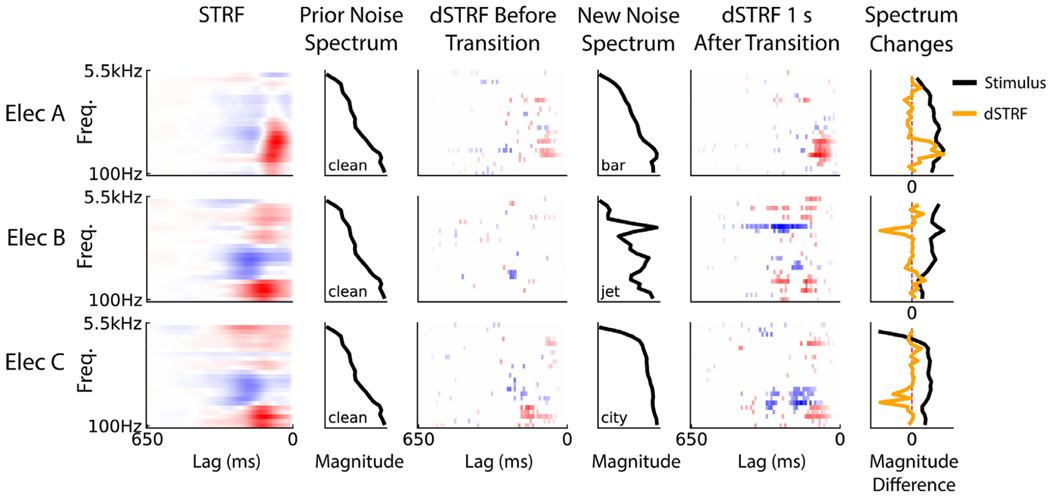
Fig. 2.
Representative dSTRF frames. dSTRF frames from four electrode models responding to a noise transition: clean-to-bar, clean-to-jet, and clean-to-city, in order from top to bottom. For each electrode, its linear STRF is shown on the left. Then, the spectrum of the noise before the transition is plotted, followed by the dSTRF frame immediately before the change (where the leading lag is a single step before the new noise onset), the spectrum of the new noise after this transition, and the dSTRF 1 s after the noise change. The dSTRF at time T seconds relative to the transition is derived by inputting the stimulus spectrogram from time T-0.65 to T to the DNN model. The rightmost column shows the change in the stimulus spectrum (the difference between the new and old noise spectrums) and the change (from before to 1s after) in the lag-averaged dSTRFs for the given noise transition. Each spectrum magnitude difference is rescaled to have unit maximum absolute value so that they are visually comparable.

