Fig. 3.

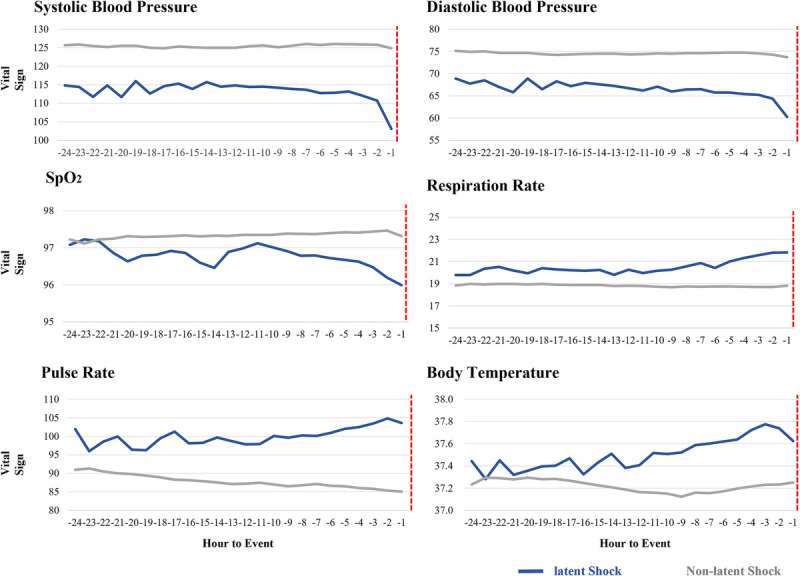
Hourly average vital sign recordings before the shock event. Red dotted lines are the time that shock occurred. SpO2, peripheral capillary oxygen saturation.

Hourly average vital sign recordings before the shock event. Red dotted lines are the time that shock occurred. SpO2, peripheral capillary oxygen saturation.