

Abstract
BACKGROUND:
Diagnostic mIBG (meta-iodobenzylguanidine) scans are an integral component of response assessment in children with high-risk neuroblastoma. The role of end of induction (EOI) Curie Scores (CS) was previously described in patients undergoing a single course of high-dose chemotherapy (HDC) and autologous hematopoietic cell transplant (AHCT) as consolidation therapy.
OBJECTIVE:
We now examine the prognostic significance of CS in patients randomized to tandem HDC and AHCT on the Children’s Oncology Group (COG) trial ANBL0532.
STUDY DESIGN:
A retrospective analysis of mIBG scans obtained from patients enrolled in COG ANBL0532 was performed. Evaluable patients had mIBG-avid, International Neuroblastoma Staging System (INSS) stage 4 disease, did not progress during induction therapy, consented to consolidation randomization, and received either single or tandem HDC (n=80). Optimal CS cut points maximized the outcome difference (≤ vs >CS cut-off) according to the Youden index.
RESULTS:
For recipients of tandem HDC, the optimal cut point at diagnosis was CS=12, with superior EFS from study enrollment for patients with CS≤12 (3-year EFS 74.2±7.9%) vs CS>12 (59.2±7.1%) (p=0.002). At EOI, the optimal cut point was CS=0, with superior end-induction EFS for patients with CS=0 (72.9±6.4%) vs CS>0 (46.5±9.1%) (p=0.002).
CONCLUSION:
In the setting of tandem transplantation for children with high-risk neuroblastoma, Curie scores at diagnosis and end-induction may identify a more favorable patient group. Patients treated with tandem HDC who exhibited a CS≤12 at diagnosis or CS=0 at EOI had superior EFS compared to those with CS above these cut points.
Keywords: neuroblastoma, mIBG, Curie score, tandem
INTRODUCTION
Outcomes for children with high-risk neuroblastoma have improved over the past two decades with the addition of immunotherapy, tandem high-dose chemotherapy (HDC) and autologous hematopoietic cell transplantation (AHCT).1–3 Park et al demonstrated a significant improvement in survival for patients treated with tandem HDC vs single HDC on the Children’s Oncology Group (COG) trial ANBL0532, “A Phase III Randomized Trial of Single versus Tandem Myeloablative Consolidation Therapy for High-Risk Neuroblastoma”, with 3-year EFS 62% vs 48%, respectively.3 Consolidative HDC regimens (followed by tandem AHCT) included cyclophosphamide/thiotepa and dose-reduced carboplatin/etoposide/melphalan (CEM); while single AHCT utilized CEM.3–5 Despite the current multimodal approach, approximately 10–15% of patients develop disease progression during induction therapy and another 40% relapse after an initial response to induction therapy.4,6 For patients who develop relapsed disease, specifically those who relapse 6–18 months from initial diagnosis, 5-year overall survival (OS) is less than 20%.7 The ability to identify both clinical and/or biologic prognostic markers of response earlier in a patient’s treatment course may guide subsequent treatment decision-making.
Meta-iodobenzylguanidine (mIBG) is a structural analogue of the catecholamine norepinephrine. Approximately 90% of neuroblastomas concentrate mIBG within sites of disease including marrow, cortical bone, and soft tissue.8–10 In 1995, a semiquantitative mIBG scoring system (Curie scoring; CS) was developed to describe the extent of mIBG uptake within individual patients, and serve as an imaging biomarker for outcome prediction.11 The role of Curie scoring as a prognostic indicator for high-risk neuroblastoma has been reported in several institutional and cooperative group trials, including trials within the COG and the International Society of Paediatric Oncology European Neuroblastoma (SIOPEN) Research Network.12–14 In particular, a CS>2 at the end of induction (EOI) was associated with inferior outcomes in two independent, cooperative group trials, the European high-risk neuroblastoma trial SIOPEN/HR-NBL1 and the COG high-risk neuroblastoma study COG A3973.12,13
To date, the prognostic significance of Curie scoring has been reported within the context of patients who underwent induction followed by consolidation therapy with a single HDC, with either busulfan/melphalan or CEM,12,13 although few patients received post-transplant anti-disialoganglioside (GD2) immunotherapy which is now considered standard of care.1,15 The aim of our current study was to investigate the prognostic significance of CS at diagnosis and at EOI for patients with newly diagnosed high-risk neuroblastoma treated with tandem HDC on COG ANBL0532, including those who also received anti-GD2 immunotherapy, with the concurrent comparison group of those randomized to single HDC.
MATERIALS AND METHODS
Patient Population
Six hundred sixty-five patients with newly diagnosed high-risk neuroblastoma were assessed for eligibility for COG ANBL0532 from November 2007 through February 2012.3 Of these 665, 355 patients with newly diagnosed high-risk neuroblastoma who were enrolled on COG ANBL0532, did not receive prior systemic therapy, did not progress or die of toxicity during induction, and underwent randomization to either single or tandem transplant were assessed for inclusion in our Curie Score analysis (Supplemental FIGURE S1).3 Among the 355 randomized patients, 228 had paired evaluable 123I-mIBG or 131I-mIBG scans available at diagnosis and EOI. Patients with mIBG non-avid disease (n=10) at diagnosis, International Neuroblastoma Staging System (INSS) non-Stage 4 disease (n=19), and those who did not undergo their assigned transplant (n=20) were excluded from the final analysis. The resulting cohort of 179 patients, including 80 patients randomized to tandem and 99 randomized to single HDC, was examined. Written informed consent was obtained from all patients (or legal guardians) before entry onto ANBL0532 and prior to consolidation randomization. The trial was registered on ClinicalTrials.gov (NCT00567567).
Treatment
Therapy on COG ANBL0532 consisted of six cycles of induction chemotherapy, surgical resection of residual soft-tissue disease following the 5th cycle of induction, randomization to single or tandem HDC and AHCT, and post-AHCT radiotherapy (Supplemental FIGURE S2).3 Following radiotherapy, patients either a) received 6 monthly cycles of isotretinoin or b) were enrolled onto COG ANBL0032 (NCT00026312) or its successor trial, COG ANBL0931 (NCT01041638). Patients enrolled on ANBL0032 were randomized to receive either immunotherapy including chimeric anti-GD2 antibody (dinutuximab) and cytokines of granulocyte colony stimulating factor and interleukin-2 plus isotretinoin or 6 monthly cycles of isotretinoin.1 Following preliminary results of superior outcomes with immunotherapy, subsequent patients were non-randomly assigned to receive dinutuximab plus cytokine immunotherapy with isotretinoin on ANBL0032 or ANBL0931.1,3,16
Diagnostic Imaging: mIBG Scans
Diagnostic imaging was performed with either 123I-mIBG or 131I-mIBG scanning techniques.8,17 For thyroid protection, supersaturated potassium iodide was given 16–24 hours before the diagnostic mIBG dose, and several days post-imaging, per institutional guidelines. 123I-mIBG or 131I-mIBG planar images, with or without single photon emission tomography (SPECT), were acquired using protocol recommended guidelines.8,17
mIBG Semiquantitative Scoring: Modified Curie Scoring Method
Curie scoring was performed from diagnostic and EOI mIBG scans using a modified Curie scoring system based on the presence of mIBG uptake in multiple anatomic regions.12,13 Ten different sites were scored, including 9 skeletal sites (head, chest, T-spine, L-spine, pelvis, upper arms, lower arms, femurs and lower legs) and an additional tenth site for soft-tissue lesions. Skeletal sites were individually scored from 0 to 3 as follows: 0, no mIBG involvement; 1, one mIBG-avid lesion present; 2, more than one mIBG-avid lesion present; and 3, mIBG avidity present in >50% of an individual site. Soft tissue lesions were scored as follows: 0, no mIBG involvement; 1, one mIBG-avid soft-tissue lesion present; 2, more than one mIBG-avid soft tissue lesions present; and 3, mIBG avidity in a soft-tissue lesion that occupied >50% of the chest or abdomen. SPECT was utilized only if available and as needed for clarification of questionable sites of mIBG uptake. An absolute score, calculated by summating the scores from the ten individual anatomic sites (with a maximum absolute score of 30), was determined. As in previous analyses, relative score reductions were obtained by dividing the difference in absolute score at EOI and diagnosis by the corresponding absolute score at diagnosis.18 Curie scoring was performed by a central scan review team, without knowledge of patient response or outcome.
Statistical Analysis
Survival analysis was performed by transplant type (single or tandem) at each mIBG scan time point (diagnosis or EOI). The primary endpoint was an EFS event; death was a secondary endpoint. An optimum cut point for total Curie score was determined for each combination (transplant type and time of mIBG scan) by maximizing the Youden index with respect to how well the Curie score differentiated patients who did and did not have an EFS event. The Youden index represents the maximum value (sensitivity + specificity – 1) over all CS threshold values.19 Event-free survival (EFS) time was calculated with two different starting points, from enrollment or from the EOI mIBG scan, until the occurrence of an event; or, if no event, until the date of last follow-up. Events included death from any cause, disease relapse or progression, or the development of a secondary malignancy. Overall survival (OS) time was calculated with two different starting points, from enrollment, or from the EOI scan to death from any cause or, if the patient was still alive, the date of last follow-up. Three-year EFS and OS estimates,20 with standard errors per Peto et al.,21 were computed for all patients for each variable investigated at the corresponding time point and transplant group. Log-rank tests were performed to compare EFS and OS, with a p-value <0.05 considered statistically significant. The data used for this analysis were current as of June 30, 2020.
Several variables were investigated for their effect on outcome, including an optimal CS cut point from the initial diagnostic and EOI mIBG scans. Outcomes based on a relative reduction in Curie scores from diagnosis to EOI were determined, using reductions of 50% and 75% as in previous analyses.
To determine the independent prognostic strength of the Curie score for survival in the presence of various prognostic factors, including age (<18 vs. ≥18 months), MYCN status (non-amplified vs. amplified), end-induction response (CR/VGPR vs. PR vs. MR/NR), and immunotherapy (yes vs. no), Cox proportional hazards (PH) models with the Efron method of handling tied event times were fit. Tests for violations of the PH assumption were performed. Backward selection was used to determine the most parsimonious model, with a threshold p-value<0.05 to remain in the model.
RESULTS
Eighty patients underwent tandem HDC and AHCT on ANBL0532 and had MIBG scans obtained at both diagnosis and end-induction. Demographics and disease characteristics for these 80 patients are shown in TABLE 1. Fifty-six tandem HDC recipients (70%) subsequently received immunotherapy with dinutuximab and cytokines, either on ANBL0032 (n=50) or ANBL0931 (n=6). Patients who did not receive immunotherapy either did not enroll on ANBL0032 or ANBL0931, or were enrolled on ANBL0032 but were not randomized to receive immunotherapy. Patient and disease characteristics for the subset of patients that underwent tandem HDC (n=80) in our CS analysis were consistent with those of the larger cohort of patients (n=355) randomized on ANBL0532 (Supplemental TABLE S1).3
TABLE 1.
Patient characteristics at diagnosis
| Variable | Characteristic | Tandem (n (%)) |
|---|---|---|
| Number of patients | 80 | |
| Sex | Female | 36 (45%) |
| Male | 44 (55%) | |
| Age (median, range), in years | 3.5 (0.87,17.39) | |
| Tumor MYCN status | Amplified | 29 (43%) |
| Nonamplified | 39 (57%) | |
| Unknown | 12 | |
| Tumor Histology | Favorable | 1 (1%) |
| Unfavorable | 74 (99%) | |
| Unknown | 5 | |
| Tumor Cell Ploidy | Hyperdiploid | 32 (52.5%) |
| Diploid | 29 (47.5%) | |
| Unknown | 19 | |
| Immunotherapy | Immunotherapy | 56 (70%) |
| No immunotherapy | 24 (30%) | |
| EOI Response | Complete or very good partial response | 33 (41%) |
| Partial response | 37 (46%) | |
| No or mixed response | 10 (12.5%) |
EOI=End-of-Induction
123I-mIBG was used in 95% (73/77) and 131I-mIBG used in 5% (4/77) of scans, with the same radioisotope used for imaging at both time points. 2 patients were missing scan type and 1 patient reported different scan types at diagnosis and end of induction.
Curie Scores at Initial Diagnosis
For tandem transplant recipients (n=80), the 3-year EFS and OS from diagnosis were 65±5% and 73±5% respectively. The median Curie score at diagnosis was 20 (range 1–28) (FIGURE 1A). The optimal cut point at diagnosis was a CS=12. Three-year EFS was significantly higher for patients with a CS≤12 at diagnosis (74±8%) when compared to patients with a CS>12 (59±7%), p=0.002 (TABLE 2) (FIGURE 2A). The 3-year OS was likewise significantly higher for patients with a CS≤12 vs >12 at diagnosis, 87±6% vs 65±7%, p=0.017.
FIGURE 1. Distribution of Curie Scores at (A) diagnosis, and (B) end of induction for patients treated with tandem high-dose chemotherapy.
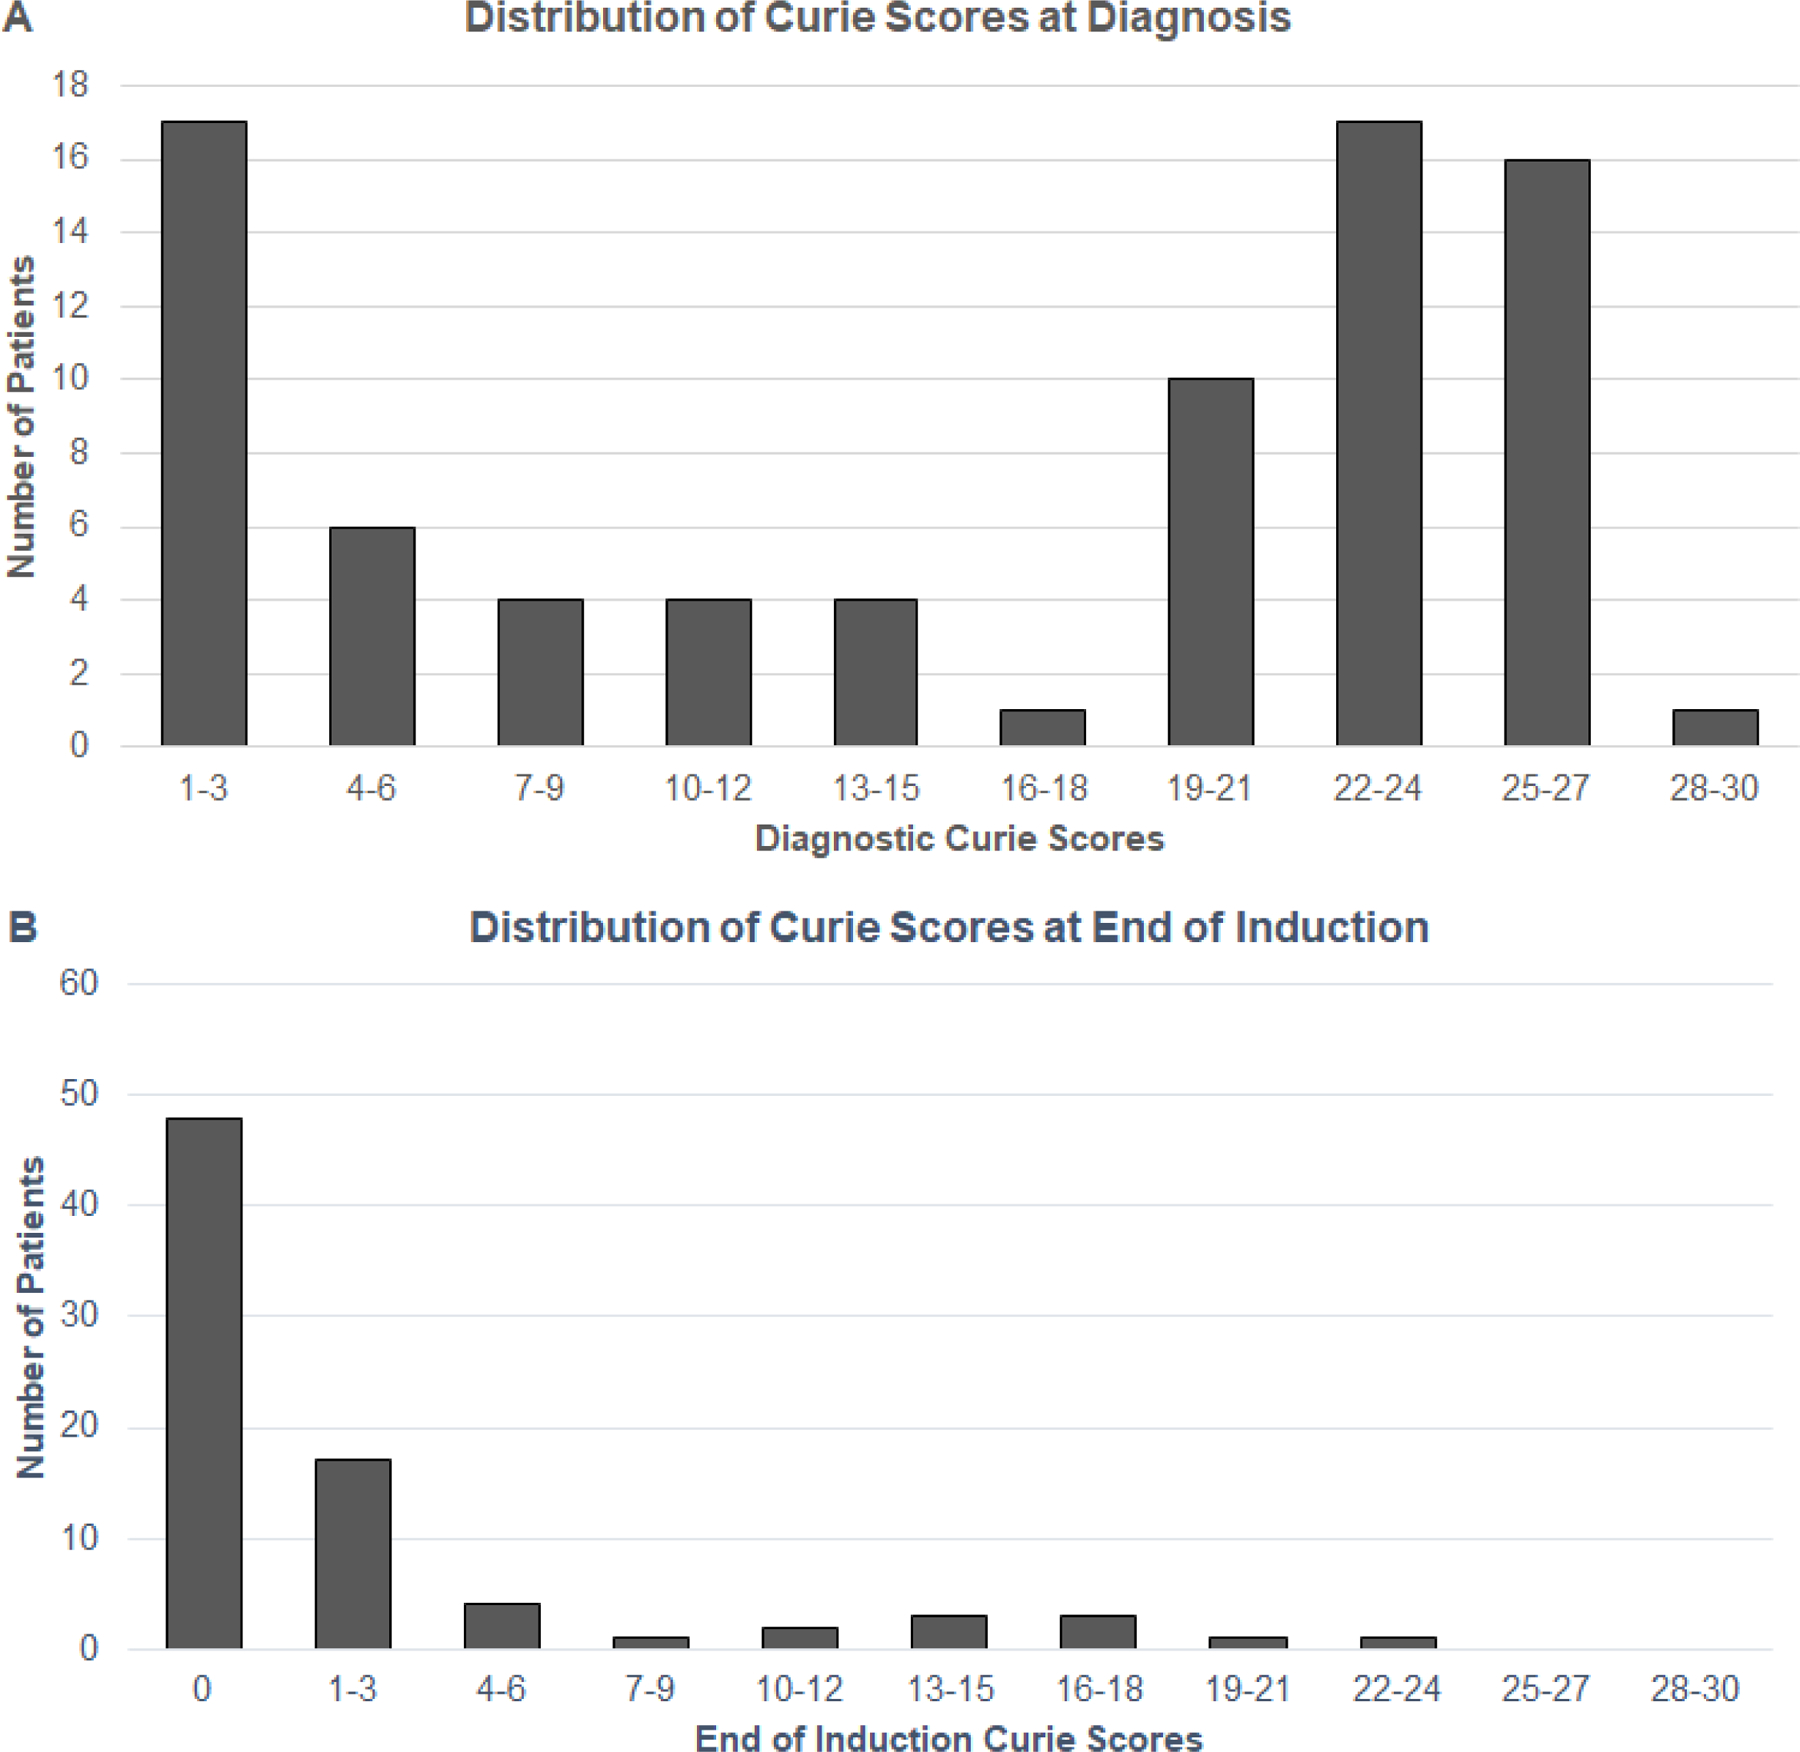
TABLE 2.
Event-free survival (EFS) and Overall survival (OS) by optimal Curie Score (CS) at diagnosis, end of induction, and relative reduction in CS in tandem high-dose chemotherapy recipients (n=80)
| CS | n (%) | 3-year EFS ± std error (%) | EFS p-value |
3-year OS ± std error (%) | OS p-value |
|---|---|---|---|---|---|
| Diagnosis | |||||
| ≤ 12 | 31 (39%) | 74 ± 8 | 0.002 | 87.1 ± 6.0 | 0.017 |
| > 12 | 49 (61%) | 59 ± 7 | 64.6 ± 7.0 | ||
| End of Induction | |||||
| 0 | 48 (60%) | 73 ± 6 | 0.002 | 83 ± 5 | 0.015 |
| > 0 | 32 (40%) | 46 ± 9 | 56 ± 9 | ||
| Relative Reduction * | |||||
| <75% | 16 (20%) | 50 ± 12 | 0.21 | 62 ± 12 | 0.51 |
| ≥75% | 64 (80%) | 66 ± 6 | 75 ± 5 | ||
| <50% | 12 (15%) | 50 ± 14 | 0.45 | 58 ± 14 | 0.67 |
| ≥50% | 68 (85%) | 65 ± 6 | 75 ± 5 |
CS=Curie Score, EFS=Event-Free Survival, OS=Overall Survival
Refers to relative reduction in CS from diagnosis to end of induction.
FIGURE 2. Event-free survival by Curie score at diagnosis in patients treated with tandem HDC. EFS by diagnostic CS using: A) Optimal cut point of 12 in all patients. (B) Optimal cut point of 12 in patients with MYCN-amplified neuroblastoma. (C) Optimal cut point of 12 in patients with MYCN-NA neuroblastoma.
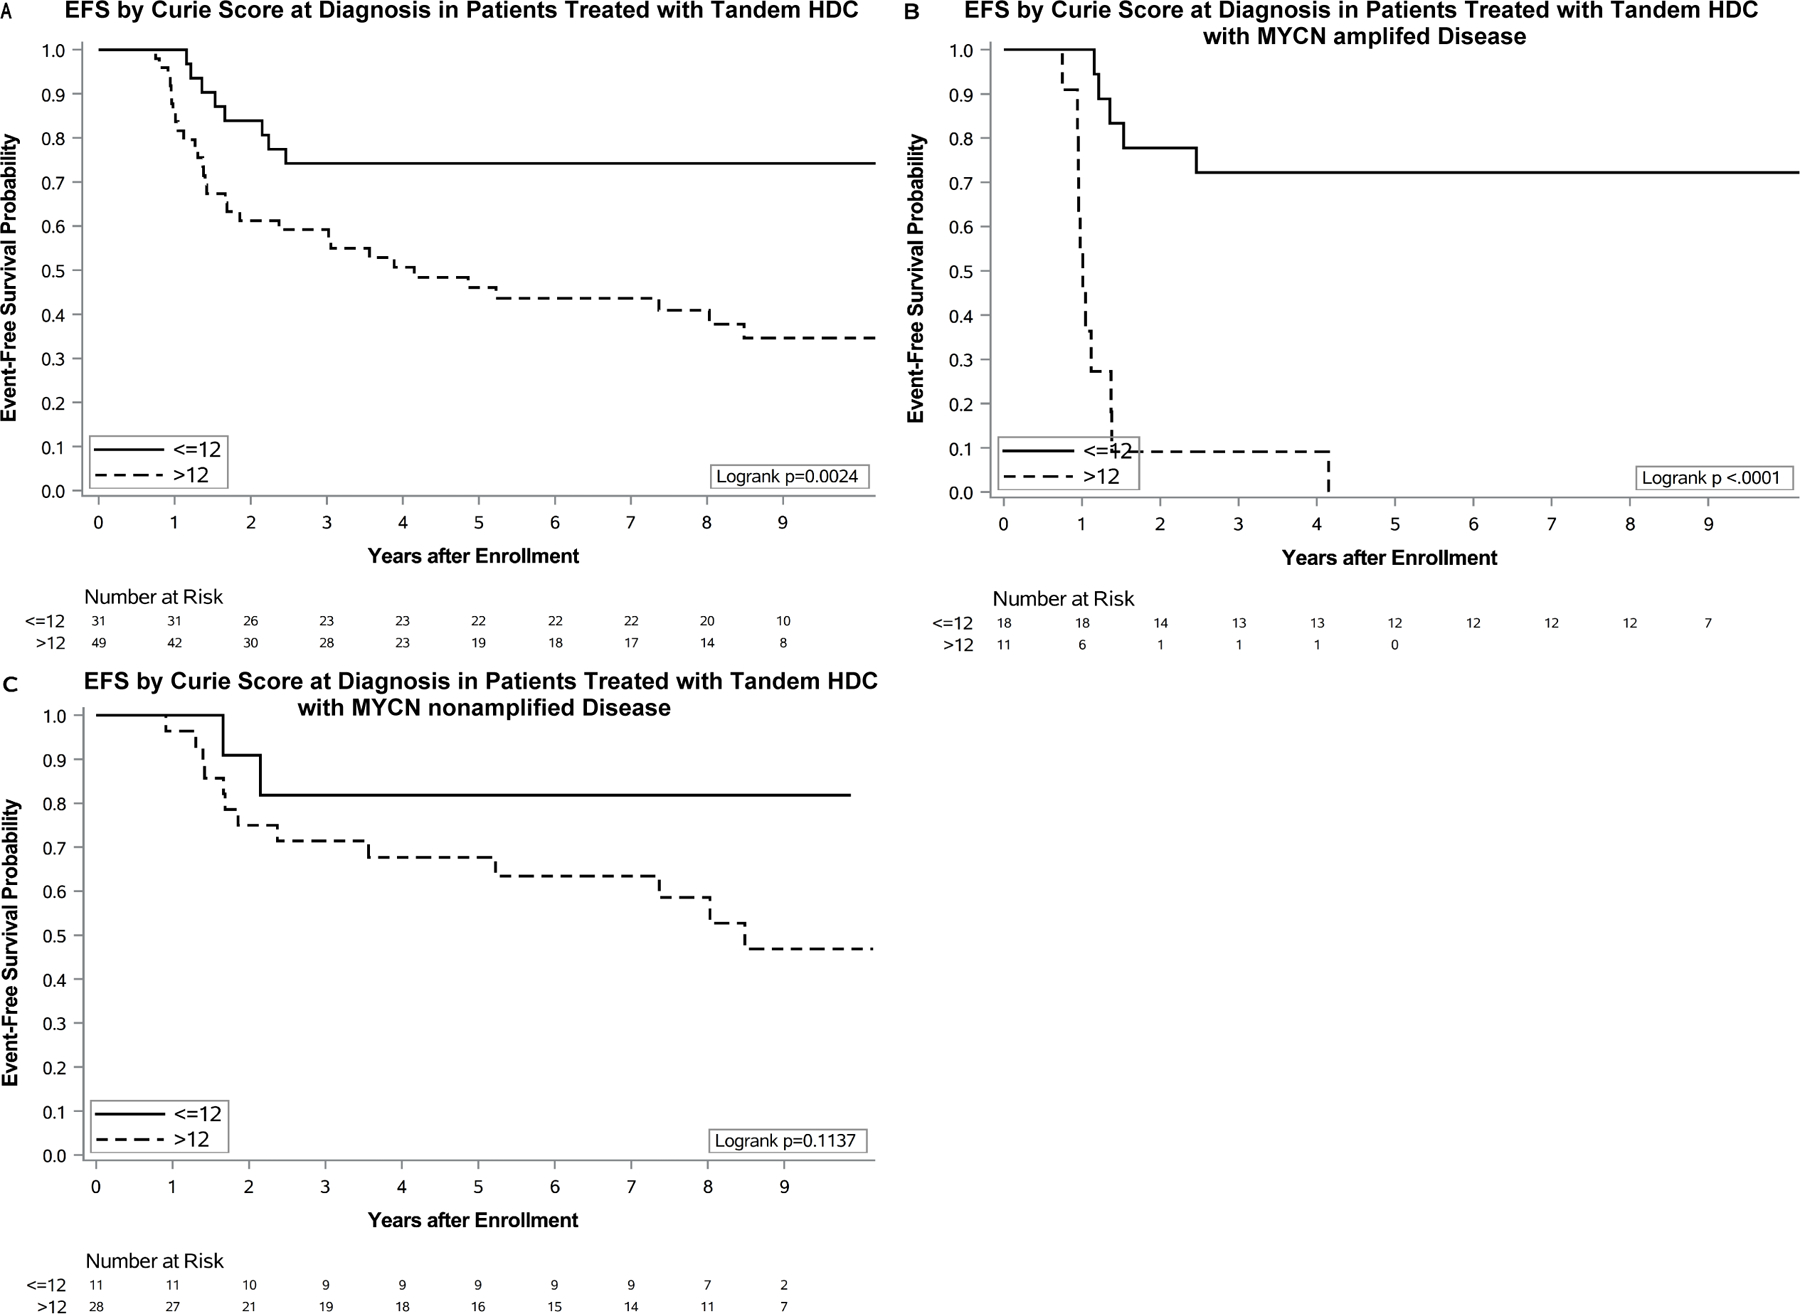
EFS= event-free survival, CS= Curie score, HDC= high-dose chemotherapy
MYCN amplification data were available for 68 of the 80 patients in the tandem transplant cohort, including 29 patients with MYCN-amplified and 39 patients with MYCN non-amplified (MYCN-NA) disease (TABLE 3). At diagnosis, median Curie scores were higher for patients with MYCN-NA [CS=22 (range 1–26)] vs MYCN-amplified disease [CS=7 (range 1–27)]. A survival advantage was noted for a small cohort of patients with MYCN-amplified disease who exhibited a CS≤12 at diagnosis, when compared to those with a CS>12 (FIGURE 2B). No survival advantage by diagnostic CS was noted for a similar cohort of patients with MYCN-NA disease (FIGURE 2C).
TABLE 3.
Impact of tumor MYCN amplification and Curie Score cut point in tandem high-dose chemotherapy recipients (n=68 with known MYCN status)
| Time Point | MYCN status | Curie Score | N (%) | 3-year EFS ± std error (%) | EFS p-value |
3-year OS ± std error (%) | OS p-value |
|---|---|---|---|---|---|---|---|
| Diagnosis | Amplified n=29 |
>12 | 11 (38%) | 9 ± 9 | <.0001 | 10 ± 10 | <.0001 |
| ≤12 | 18 (62%) | 72 ± 11 | 78 ± 10 | ||||
| NA n=39 |
>12 | 28 (72%) | 71 ± 9 | 0.11 | 78 ± 8 | 0.17 | |
| ≤12 | 11 (28%) | 82 ± 12 | 100 ± 0 | ||||
| End of Induction | Amplified n=29 |
>0 | 8 (28%) | 12 ± 12 | 0.01 | 12 ± 12 | 0.006 |
| 0 | 21 (72%) | 62 ± 11 | 70 ± 10 | ||||
| NA n=39 |
>0 | 19 (49%) | 63 ± 12 | 0.01 | 73 ± 10 | 0.19 | |
| 0 | 20 (51%) | 85 ± 8 | 95 ± 5 |
NA=non-amplified, EFS=event-free survival, OS=overall survival
End of Induction (EOI) Curie Scores
For patients undergoing tandem HDC, the median Curie score at EOI was 0 (range 0 to 23) and the median change in Curie score was −11.5 (range −27 to 0) from diagnosis to EOI (FIGURE 1B). The optimal CS cut point at EOI was 0 for recipients of tandem HDC. Three-year EFS was significantly greater in patients with a CS=0 (n=48) vs >0 (n=32) at EOI, 73±6% vs 46±9%, p=0.002. Similarly, 3-year OS was superior in patients with a CS=0 vs >0 at EOI, 83±5% vs 56±9%, p=0.015 (TABLE 2) (FIGURE 3A). When restricting the analysis to the 56 patients who received tandem transplant and immunotherapy, EOI CS remained significant, with 3-year EFS 81±6% vs 58±11% for those with a CS=0 (n=37) vs CS>0 (n=19) respectively; p=0.016. No statistical difference was noted in OS for this same population, p=0.06.
FIGURE 3. Event-free survival by Curie score at end of induction in patients treated with tandem HDC. EFS by EOI CS using: (A) Optimal cut point of 0 in all patients. (B) Optimal cut point of 0 in patients with MYCN-amplified neuroblastoma. (C) Optimal cut point of 0 in patients with MYCN-NA neuroblastoma.
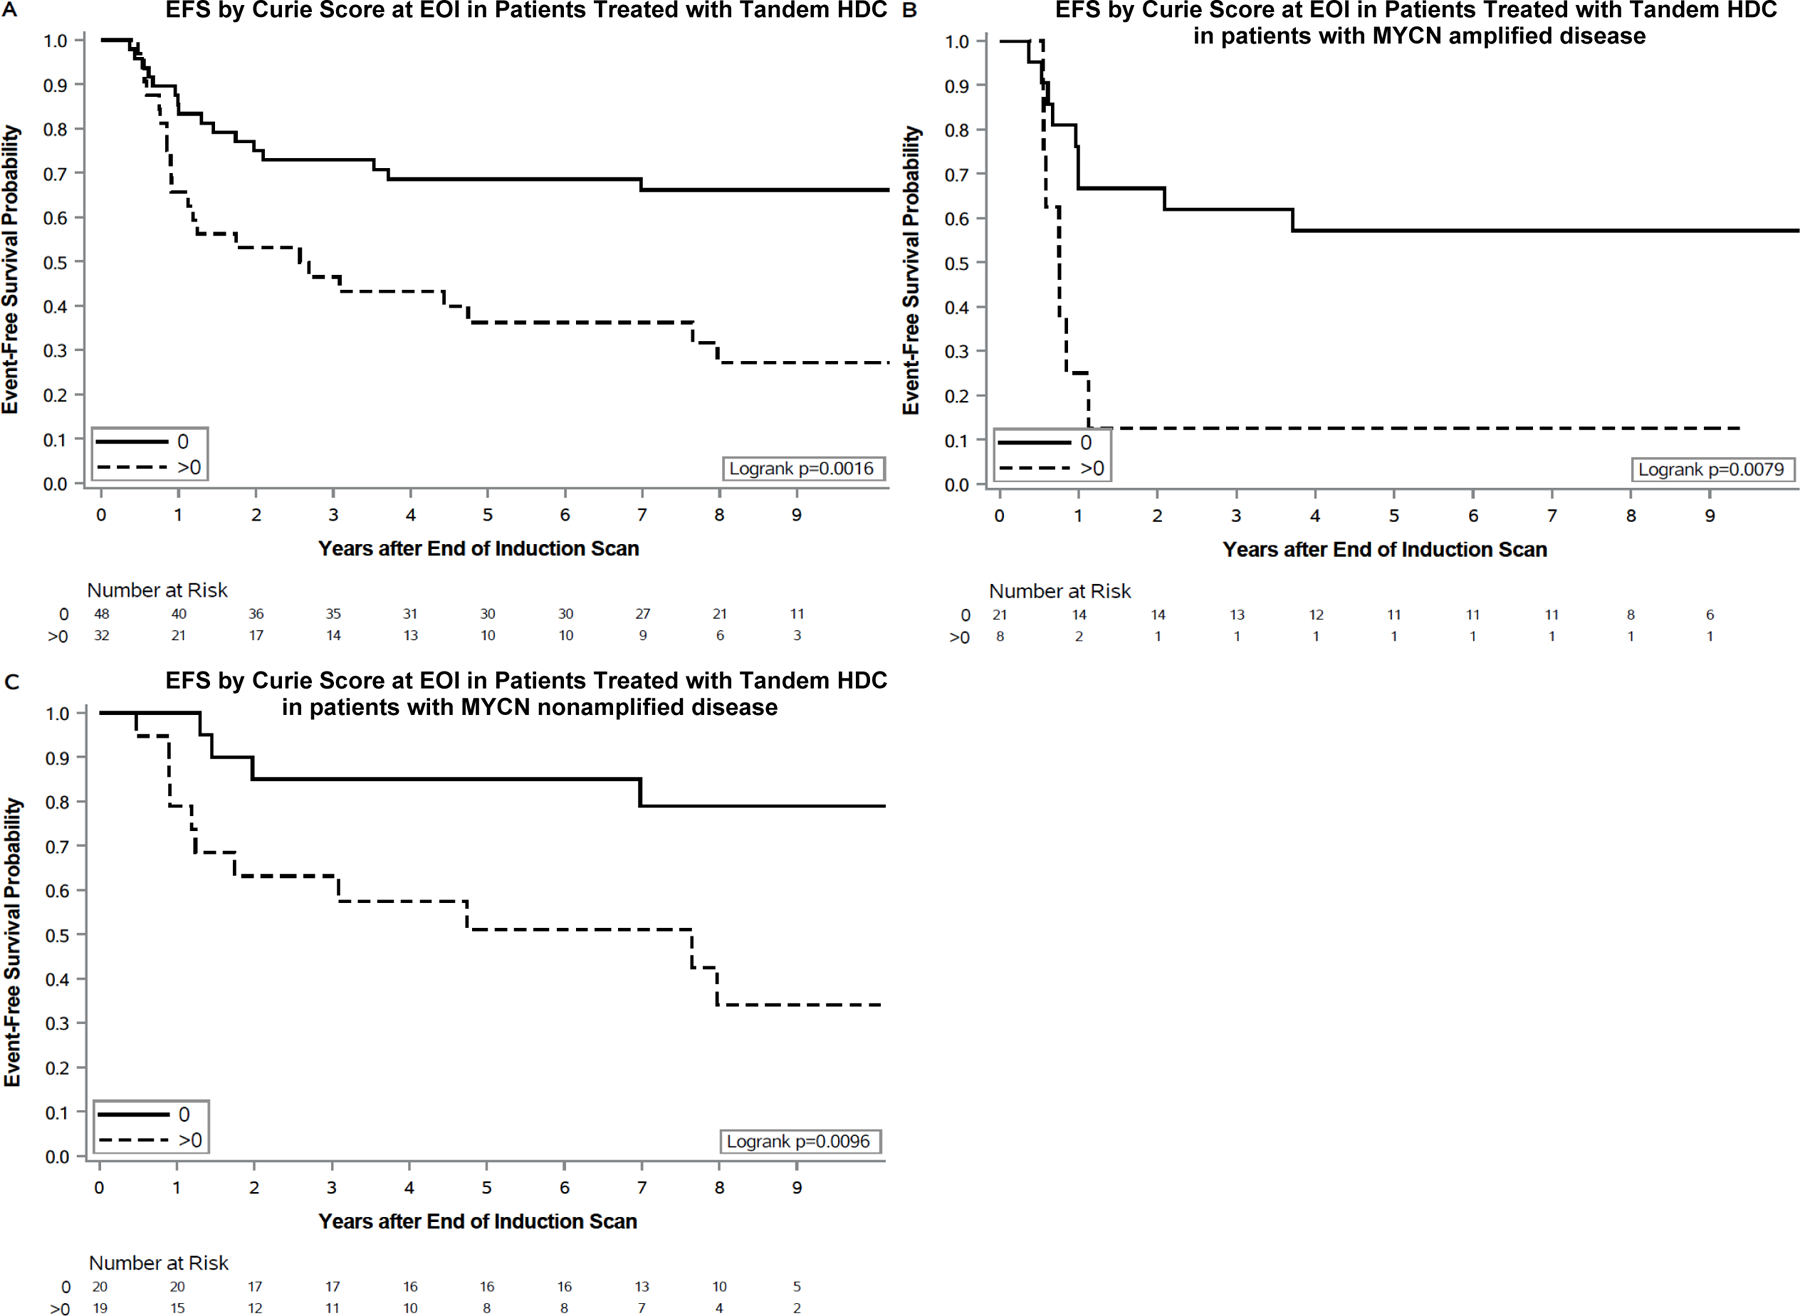
EFS= event-free survival, CS= Curie score, HDC= high-dose chemotherapy, EOI= end of induction
Outcomes based upon CS at EOI are shown by MYCN status (TABLE 3) (FIGURE 3B–C). In this small cohort of patients with either MYCN-amplified or MYCN-NA disease, 3-year EFS was superior in patients with a CS=0 (vs >0) at EOI.
Relative Curie scores, including either a 50% or 75% reduction in CS from diagnosis to EOI, were not associated with a statistically significant difference in EFS or OS in recipients of tandem HDC (TABLE 2).
Multivariable Cox models
Using a CS cut point of 12 at diagnosis and 0 at EOI, a backward-selected Cox model showed that CS at diagnosis, EOI CS, MYCN status, and receipt of immunotherapy were each independently prognostic of EFS. CS >12 at diagnosis was associated with a >14-fold higher risk of an event (n=68; p<0.0001), while EOI CS >0 was associated with a 3-fold higher risk of an event (p=0.0149), MYCN amplification was associated with a 21-fold higher risk of an event (p<0.0001), and non-receipt of immunotherapy was associated with a 4-fold higher risk of an event (p=0.0008).
For OS, using the same factors as for EFS, a backward-selected Cox model indicated that CS at diagnosis, MYCN status, and immunotherapy were prognostic of OS, with CS >12 at diagnosis, MYCN amplification, and no immunotherapy corresponding to an increase in the risk of death of 13 (n=68; P<0.0001), 15 (P<0.0001), and 4 (P=0.0006), respectively.
Single transplant: CS at diagnosis and end of induction
Though the focus of this report is on recipients of tandem transplant, a sub-analysis was performed to permit assessment of the CS cut point in a contemporaneously treated group of patients randomized to undergo a single HDC (n=99) on ANBL0532 (Supplemental TABLE S1). The optimal CS cut point at diagnosis was 21, with a median CS of 15 (range 1–28) (Supplemental Table S2). The 3-year EFS for patients with CS<21 (n=72) vs >21 (n=27) at diagnosis was 51±6% vs 35±9%; p=0.04 (Supplemental FIGURE S3A–C).
At EOI, the optimal EOI CS cut point was 2, with a median CS=0 (range 0–21). However, the difference in EFS for patients with CS<2 (n=81) vs CS>2 (n=18) at EOI was not statistically significant, with 3-year EFS 46±6% vs 29±11%; p=0.29 (Supplemental Figure S3D–F).
DISCUSSION
This is the first COG study to examine the impact of CS in the setting of tandem HDC and AHCT. Our study identified optimal CS cut points with prognostic significance at diagnosis (CS=12) and EOI (CS=0) in a subset of patients with INSS stage 4 disease who received tandem HDC on COG ANBL0532. Patients with a CS≤12 at diagnosis had a statistically significantly higher 3-year EFS and OS when compared to those with a CS>12 at the same timepoint. Patients with a CS=0 at EOI also had a statistically significantly higher 3-year EFS and OS than those with CS>0 at EOI.
The role of CS as a prognostic indicator in high-risk neuroblastoma has been reported within the context of clinical trials utilizing single HDC, both within COG and European cooperative groups.12,13,22–24 In a prior COG study, we found no correlation between CS at diagnosis and subsequent outcome following single HDC.12 In contrast, a prior SIOPEN study noted the prognostic impact of skeletal-only mIBG scores at initial diagnosis, using either a SIOPEN-specific or a CS system for analysis.13,14 Within both COG and SIOPEN, an optimal mIBG cut point at EOI was described for single HDC recipients, with EOI CS≤2 associated with improved outcomes in patients treated on COG A397312 or SIOPEN-HR-NBL-1.13 Our current study confirmed this optimal CS cut point (CS=2) in single HDC recipients, though the differences in EFS (CS≤2 vs CS>2) were not significant.
Important distinctions should be noted between the CS performed on tandem HDC recipients on COG ANBL0532 and the scoring performed on single HDC recipients on COG A3973. Curie scoring in ANBL0532 involved a more contemporary group of patients, with 70% of patients receiving immunotherapy with dinutuximab and cytokines following tandem HDC. In contrast, less than 20% of patients with Curie scoring performed in COG A3973 received similar immunotherapy. Whereas CS from patients treated on COG A3973 identified an ultra-high-risk group of patients with poor outcomes (3-year EFS=15% for patients with CS>2 at EOI), our current CS analysis of ANBL0532 tandem HDC recipients did not identify an ultra-high-risk group, but instead identified a potentially more favorable risk group (CS=0 at EOI) with promising 3-year EFS (73%) and 3-year OS (83%). Conversely, tandem HDC recipients with a CS>0 at EOI in our current analysis had similar 3-year EFS as the “favorable” risk group (CS<2) identified in our prior COG A3973 analysis, with 3-year EFS of 46% and 45% respectively.12 The novel CS cut point of 0 in the setting of tandem HDC warrants further investigation in ongoing and upcoming COG clinical trials.
The importance of achieving a complete response (CR) at EOI has been reported in other COG trials, with 5-year EFS approximately 60% vs 40% for patients in CR vs non-CR at EOI in various reports.25 Taken together, the importance of achieving CS=0 at EOI is further validated in our current study. Ultimately a composite EOI response marker could be developed, incorporating both diagnostic and EOI CS with other tumor response indicators and biologic markers of disease (e.g., circulating tumor DNA, telomere maintenance mechanism status, or other genomic features).26–28
The current practice for disease response evaluation has changed since the COG A3973 analysis, with the revision of the INRC in 2017.18 The revised INRC include assessment of response in the primary tumor, bone marrow and metastatic disease sites, with CS now incorporated into the metastatic response assessment. In particular, INRC currently define a metastatic response as a 50% reduction in Curie scores from diagnosis to the evaluation timepoint. However, based upon our current analysis, the absolute score should be considered instead of a “relative reduction in score” for assessing response in metastatic sites. We found no difference in outcomes based upon the relative reduction of CS from diagnosis to EOI (TABLE 2). Several previous studies also reported that relative reductions in CS did not provide additional prognostic information when compared with absolute scores alone, including results from COG A3973,12 the German Neuroblastoma Trial NB97,22 and SIOPEN HR-NBL1.13 In future studies, we will prospectively examine the CS cut points at diagnosis and EOI using both an absolute CS and a 50% relative reduction in CS, to determine if the INRC definition of metastatic response should be redefined for EOI response.
The outcome differences noted in our study were most striking in patients with MYCN-amplified disease, in which patients with a diagnostic CS>12, or CS>0 at EOI had extremely poor outcomes. Definitive conclusions regarding the impact of CS in patients with MYCN-amplified disease are difficult to make, given the small sample size of the MYCN-amplified cohort in our current study. The difference in prognostic value of Curie scores in patients whose tumors are MYCN amplified vs MYCN non-amplified may reflect a difference in patterns of mIBG uptake between the two groups. A previous study in patients with INSS stage 4 neuroblastoma described two distinct mIBG uptake patterns within individual anatomic regions, with “focal” uptake patterns more commonly described in patients with MYCN-amplified disease and “diffuse” uptake patterns commonly described in patients with MYCN-NA disease.29 This difference, focal vs diffuse uptake within a given anatomic region, could potentially account for higher CS in patients with MYCN-NA disease. The lower mIBG avidity in patients with MYCN-amplified disease may also reflect lower levels of norepinephrine transporter expression in the setting of MYCN-amplified disease.30 Further analysis of the impact of CS in patients with MYCN-amplified disease will be performed in upcoming COG high-risk neuroblastoma therapy trials.
One major limitation of this study is the potential for selection bias, as a more favorable group of patients may have comprised the subset that underwent randomization and completed consolidation treatment on ANBL0532. Parent or physician preference led to a substantial number of patients that never underwent randomization to single or tandem HDC, potentially due to an inadequate response to induction therapy (even without overt disease progression) and/or concern for increased toxicities. As previously reported, we found a higher percentage of patients had a mixed response or no response at EOI who were not randomized compared to those who underwent randomization (25% vs 9%; p<0.001). Furthermore, our study excluded patients with neuroblastoma progression during induction (or prior to consolidation therapy), and patients who died and/or had organ toxicity that precluded continuation on protocol therapy during induction. As was previously stated, the higher EFS rate associated with tandem high-dose chemotherapy and HSCT is relevant only within the context of the total therapy delivered (not all patients were eligible to receive HDC and/or immunotherapy due to disease progression) and it remains unknown whether tandem transplant will be beneficial when administered after other currently used induction regimens. Nearly 10% of patients on ANBL0532 did not continue beyond induction (and thus were excluded from the current CS analysis) which lends further support to the investigation of novel induction therapy approaches.3 The small sample size of the patient cohort in the current analysis was also a limitation, particularly for those with MYCN-amplified tumors. The effect of tandem HDC in the randomized cohort on ANBL0532 remained statistically significant after adjustment by end-induction response, INSS stage, age, MYCN status, and INPC histology.3 Given the limitations of ANBL0532 outlined above, it remains unclear which subpopulations of high-risk neuroblastoma have the most benefit from tandem vs single high-dose chemotherapy regimens followed by AHSCT.
CONCLUSION
The role of CS as a prognostic marker in high-risk neuroblastoma patients undergoing tandem HDC and AHCT was examined in our study. We identified an optimal CS cut point both at diagnosis (CS≤12 vs>12) and EOI (CS=0 vs CS>0) and demonstrated that patients with CS at or below those cut points have potentially more favorable outcomes. The role of CS as a prognostic indicator in tandem HDC patients will require validation in future COG high-risk neuroblastoma trials, including the current COG trial, COG ANBL1531. Ultimately, further improvements in outcome may depend on improved induction therapy regimen, either with the addition of targeted agents like 131I-mIBG (COG ANBL1531) or anti-GD2 antibody (COG ANBL2131) or with additional induction therapies for patients with inadequate induction therapy response31.
Supplementary Material
ACKNOWLEDGMENTS
We thank Thomas J. FitzGerald, MD, and the staff at the Quality Assurance Review Center (QARC), especially Deirdre Logan, Sandy Kessel, and Fran Laurie, for their tremendous support.
Financial Disclosure Statement:
Financial Support:
Supported by National Institutes of Health, National Cancer Institute (Grant No. U10 CA180899 to Children’s Oncology Group Statistics and Data Center), National Clinical Trials Network Operations Center (Grant U10 CA180886), and St Baldrick’s Foundation.
Abbreviations
- AHCT
Autologous hematopoietic cell transplant
- CEM
Carboplatin, etoposide, melphalan
- CR
Complete response
- CS
Curie score
- COG
Children’s Oncology Group
- EFS
Event-free survival
- EOI
End of induction
- HDC
High-dose chemotherapy
- INRC
International neuroblastoma response criteria
- INSS
International neuroblastoma staging system
- mIBG
metaiodobenzylguanidine
- MR
Mixed response
- MYCN NA
MYCN nonamplified
- NR
No response
- OS
Overall survival
- PH
Proportional hazards
- PR
Partial response
- SIOPEN
Society International of Pediatric Oncology Europe Neuroblastoma
- SPECT
Single photon emission computed tomography
- VGPR
Very good partial response
Footnotes
Conflicts of interest: Keri A. Streby is a consultant for Innervate Radiopharmaceuticals LLC and YmAbs Therapeutics Inc. and Kate Matthay is a consultant for Innervate Radiopharmaceuticals LLC.
Impact of diagnostic and end-of-induction Curie scores in tandem autologous hematopoietic cell transplant for patients with high-risk neuroblastoma: A report from the Children’s Oncology Group. American Society of Clinical Oncology. June 6, 2022. www.asco.org
Disclaimer: The content is solely the responsibility of the authors and does not necessarily represent the official views of the National Institutes of Health.
REFERENCES
- 1.Yu AL, Gilman AL, Ozkaynak MF, et al. Anti-GD2 antibody with GM-CSF, interleukin-2, and isotretinoin for neuroblastoma. N Engl J Med Sep 2010;363(14):1324–34. doi: 10.1056/NEJMoa0911123 [DOI] [PMC free article] [PubMed] [Google Scholar]
- 2.Yu AL, Gilman AL, Ozkaynak MF, et al. Long-Term Follow-up of a Phase III Study of ch14.18 (Dinutuximab) + Cytokine Immunotherapy in Children with High-Risk Neuroblastoma: COG Study ANBL0032. Clin Cancer Res Apr 15 2021;27(8):2179–2189. doi: 10.1158/1078-0432.CCR-20-3909 [DOI] [PMC free article] [PubMed] [Google Scholar]
- 3.Park JR, Kreissman SG, London WB, et al. Effect of Tandem Autologous Stem Cell Transplant vs Single Transplant on Event-Free Survival in Patients With High-Risk Neuroblastoma: A Randomized Clinical Trial. JAMA August 27 2019;322(8):746–755. doi: 10.1001/jama.2019.11642 [DOI] [PMC free article] [PubMed] [Google Scholar]
- 4.Kreissman SG, Seeger RC, Matthay KK, et al. Purged versus non-purged peripheral blood stem-cell transplantation for high-risk neuroblastoma (COG A3973): a randomised phase 3 trial. Lancet Oncol Sep 2013;14(10):999–1008. doi: 10.1016/S1470-2045(13)70309-7 [DOI] [PMC free article] [PubMed] [Google Scholar]
- 5.Seif AE, Naranjo A, Baker DL, et al. A pilot study of tandem high-dose chemotherapy with stem cell rescue as consolidation for high-risk neuroblastoma: Children’s Oncology Group study ANBL00P1. Bone Marrow Transplant Jul 2013;48(7):947–52. doi: 10.1038/bmt.2012.276 [DOI] [PMC free article] [PubMed] [Google Scholar]
- 6.Matthay KK, Reynolds CP, Seeger RC, et al. Long-term results for children with high-risk neuroblastoma treated on a randomized trial of myeloablative therapy followed by 13-cis-retinoic acid: a children’s oncology group study. J Clin Oncol Mar 2009;27(7):1007–13. doi: 10.1200/JCO.2007.13.8925 [DOI] [PMC free article] [PubMed] [Google Scholar]
- 7.London WB, Castel V, Monclair T, et al. Clinical and biologic features predictive of survival after relapse of neuroblastoma: a report from the International Neuroblastoma Risk Group project. J Clin Oncol Aug 2011;29(24):3286–92. doi: 10.1200/JCO.2010.34.3392 [DOI] [PMC free article] [PubMed] [Google Scholar]
- 8.Shulkin BL, Shapiro B. Current concepts on the diagnostic use of MIBG in children. J Nucl Med Apr 1998;39(4):679–88. [PubMed] [Google Scholar]
- 9.Lumbroso JD, Guermazi F, Hartmann O, et al. Meta-iodobenzylguanidine (mIBG) scans in neuroblastoma: sensitivity and specificity, a review of 115 scans. Prog Clin Biol Res 1988;271:689–705. [PubMed] [Google Scholar]
- 10.Claudiani F, Stimamiglio P, Bertolazzi L, et al. Radioiodinated meta-iodobenzylguanidine in the diagnosis of childhood neuroblastoma. Q J Nucl Med Dec 1995;39(4 Suppl 1):21–4. [PubMed] [Google Scholar]
- 11.Ady N, Zucker JM, Asselain B, et al. A new 123I-MIBG whole body scan scoring method--application to the prediction of the response of metastases to induction chemotherapy in stage IV neuroblastoma. Eur J Cancer 1995;31A(2):256–61. doi: 10.1016/0959-8049(94)00509-4 [DOI] [PubMed] [Google Scholar]
- 12.Yanik GA, Parisi MT, Shulkin BL, et al. Semiquantitative mIBG scoring as a prognostic indicator in patients with stage 4 neuroblastoma: a report from the Children’s oncology group. J Nucl Med Apr 2013;54(4):541–8. doi: 10.2967/jnumed.112.112334 [DOI] [PMC free article] [PubMed] [Google Scholar]
- 13.Yanik GA, Parisi MT, Naranjo A, et al. Validation of Postinduction Curie Scores in High-Risk Neuroblastoma: A Children’s Oncology Group and SIOPEN Group Report on SIOPEN/HR-NBL1. J Nucl Med March 2018;59(3):502–508. doi: 10.2967/jnumed.117.195883 [DOI] [PMC free article] [PubMed] [Google Scholar]
- 14.Lewington V, Lambert B, Poetschger U, et al. I-mIBG scintigraphy in neuroblastoma: development of a SIOPEN semi-quantitative reporting, method by an international panel. Eur J Nucl Med Mol Imaging Feb 2017;44(2):234–241. doi: 10.1007/s00259-016-3516-0 [DOI] [PMC free article] [PubMed] [Google Scholar]
- 15.Ladenstein R, Pötschger U, Valteau-Couanet D, et al. Investigation of the Role of Dinutuximab Beta-Based Immunotherapy in the SIOPEN High-Risk Neuroblastoma 1 Trial (HR-NBL1). Cancers (Basel) Jan 28 2020;12(2)doi: 10.3390/cancers12020309 [DOI] [PMC free article] [PubMed] [Google Scholar]
- 16.Ozkaynak MF, Gilman AL, London WB, et al. A Comprehensive Safety Trial of Chimeric Antibody 14.18 With GM-CSF, IL-2, and Isotretinoin in High-Risk Neuroblastoma Patients Following Myeloablative Therapy: Children’s Oncology Group Study ANBL0931. Front Immunol 2018;9:1355. doi: 10.3389/fimmu.2018.01355 [DOI] [PMC free article] [PubMed] [Google Scholar]
- 17.Matthay KK, Shulkin B, Ladenstein R, et al. Criteria for evaluation of disease extent by (123)I-metaiodobenzylguanidine scans in neuroblastoma: a report for the International Neuroblastoma Risk Group (INRG) Task Force. Br J Cancer Apr 27 2010;102(9):1319–26. doi: 10.1038/sj.bjc.6605621 [DOI] [PMC free article] [PubMed] [Google Scholar]
- 18.Park JR, Bagatell R, Cohn SL, et al. Revisions to the International Neuroblastoma Response Criteria: A Consensus Statement From the National Cancer Institute Clinical Trials Planning Meeting. J Clin Oncol Aug 2017;35(22):2580–2587. doi: 10.1200/JCO.2016.72.0177 [DOI] [PMC free article] [PubMed] [Google Scholar]
- 19.YOUDEN WJ. Index for rating diagnostic tests. Cancer Jan 1950;3(1):32–5. doi: [DOI] [PubMed] [Google Scholar]
- 20.Kaplan E, Meier P. Nonparametric estimation from incomplete observations. Journal of American Statistics 1958;(53):457–481. [Google Scholar]
- 21.Peto R, Pike MC, Armitage P, et al. Design and analysis of randomized clinical trials requiring prolonged observation of each patient. II. analysis and examples. Br J Cancer Jan 1977;35(1):1–39. doi: 10.1038/bjc.1977.1 [DOI] [PMC free article] [PubMed] [Google Scholar]
- 22.Decarolis B, Schneider C, Hero B, et al. Iodine-123 metaiodobenzylguanidine scintigraphy scoring allows prediction of outcome in patients with stage 4 neuroblastoma: results of the Cologne interscore comparison study. J Clin Oncol Mar 01 2013;31(7):944–51. doi: 10.1200/JCO.2012.45.8794 [DOI] [PubMed] [Google Scholar]
- 23.Ladenstein R, Lambert B, Pötschger U, et al. Validation of the mIBG skeletal SIOPEN scoring method in two independent high-risk neuroblastoma populations: the SIOPEN/HR-NBL1 and COG-A3973 trials. Eur J Nucl Med Mol Imaging Feb 2018;45(2):292–305. doi: 10.1007/s00259-017-3829-7 [DOI] [PMC free article] [PubMed] [Google Scholar]
- 24.Schmidt M, Simon T, Hero B, Schicha H, Berthold F. The prognostic impact of functional imaging with (123)I-mIBG in patients with stage 4 neuroblastoma >1 year of age on a high-risk treatment protocol: results of the German Neuroblastoma Trial NB97. Eur J Cancer Jul 2008;44(11):1552–8. doi: 10.1016/j.ejca.2008.03.013 [DOI] [PubMed] [Google Scholar]
- 25.Pinto N, Naranjo A, Hibbitts E, et al. Predictors of differential response to induction therapy in high-risk neuroblastoma: A report from the Children’s Oncology Group (COG). Eur J Cancer May 2019;112:66–79. Doi: 10.1016/j.ejca.2019.02.003 [DOI] [PMC free article] [PubMed] [Google Scholar]
- 26.Weiser DA, West-Szymanski DC, Fraint E, et al. Progress toward liquid biopsies in pediatric solid tumors. Cancer Metastasis Rev December 2019;38(4):553–571. doi: 10.1007/s10555-019-09825-1 [DOI] [PMC free article] [PubMed] [Google Scholar]
- 27.Koneru B, Lopez G, Farooqi A, et al. Telomere Maintenance Mechanisms Define Clinical Outcome in High-Risk Neuroblastoma. Cancer Res June 15 2020;80(12):2663–2675. doi: 10.1158/0008-5472.CAN-19-3068 [DOI] [PMC free article] [PubMed] [Google Scholar]
- 28.Attiyeh EF, London WB, Mossé YP, et al. Chromosome 1p and 11q deletions and outcome in neuroblastoma. N Engl J Med Nov 24 2005;353(21):2243–53. doi: 10.1056/NEJMoa052399 [DOI] [PubMed] [Google Scholar]
- 29.Bleeker G, van Eck-Smit BL, Zwinderman KH, et al. MIBG scans in patients with stage 4 neuroblastoma reveal two metastatic patterns, one is associated with MYCN amplification and in MYCN-amplified tumours correlates with a better prognosis. Eur J Nucl Med Mol Imaging 2015;42(2):222–30. doi: 10.1007/s00259-014-2909-1 [DOI] [PMC free article] [PubMed] [Google Scholar]
- 30.DuBois SG, Geier E, Batra V, et al. Evaluation of norepinephrine transporter expression and Metaiodobenzylguanidine Avidity in Neuroblastoma: A Report from the Children’s Oncology Group. Int J Mol Imaging 2012;2012:250834. doi: 10.1155/2012/250834. [DOI] [PMC free article] [PubMed] [Google Scholar]
- 31.Desai AV, Applebaum MA, Karrison TG, et al. Efficacy of post-induction therapy for high-risk neuroblastoma patients with end-induction residual disease. Cancer Aug 2022;128(15):2967–2977. [DOI] [PMC free article] [PubMed] [Google Scholar]
Associated Data
This section collects any data citations, data availability statements, or supplementary materials included in this article.