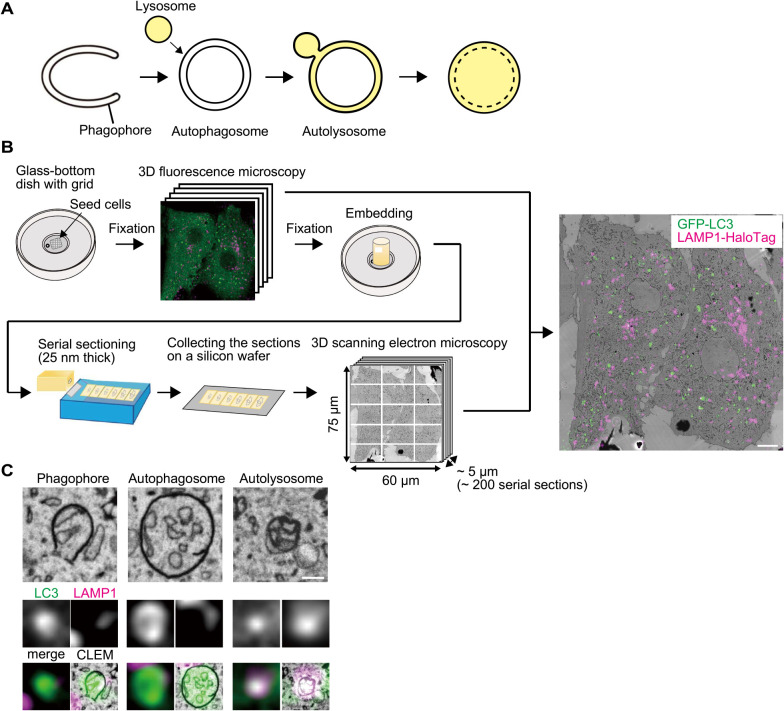
Fig. 1.
3D-CLEM procedure with array tomography
(A) A model of autophagosome and autolysosome formation. (B) Schematic representation of the procedure for 3D-correlative light and electron microscopy (CLEM) with array tomography. A representative CLEM image of mouse embryonic fibroblasts (MEFs) stably expressing GFP-LC3 (green) and LAMP1-HaloTag (magenta) is shown. Scale bar, 5 μm. (C) Examples of a phagophore, autophagosome, and autolysosome are shown. Scale bar, 0.2 μm.

