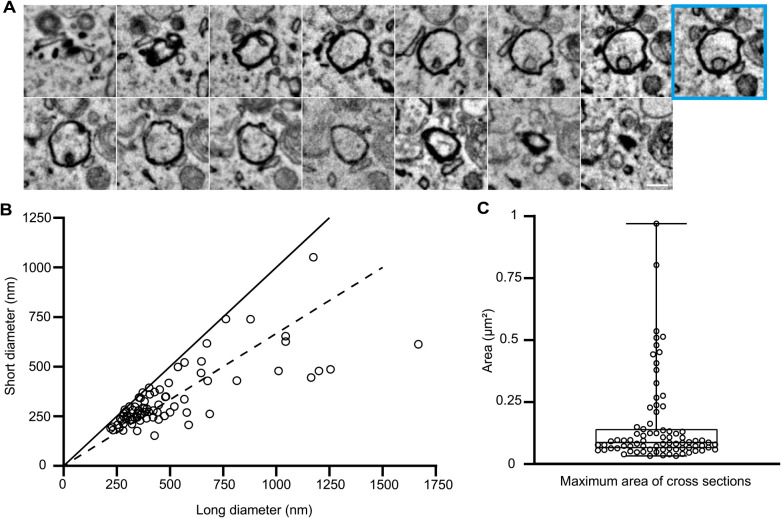
Fig. 2.
Distribution of autophagosomal diameters and maximum areas
(A) Serial EM images (25-nm thickness) of an autophagosome are shown. The section with the maximum area is indicated by a cyan square. Scale bar, 0.2 μm. (B) Distribution of the short and long diameters in the maximum areas of 79 autophagosomes. The closer the plots are to the line, the more spherical the autophagosomes appear. The dotted line indicates where the long diameters are 1.5× greater than the short diameters. (C) The maximum area of cross-sections was calculated based on the long and short diameters. In the box plot, a solid bar indicates median, a box indicates the interquartile range (25th to 75th percentile), and whiskers indicate the largest and smallest values.

