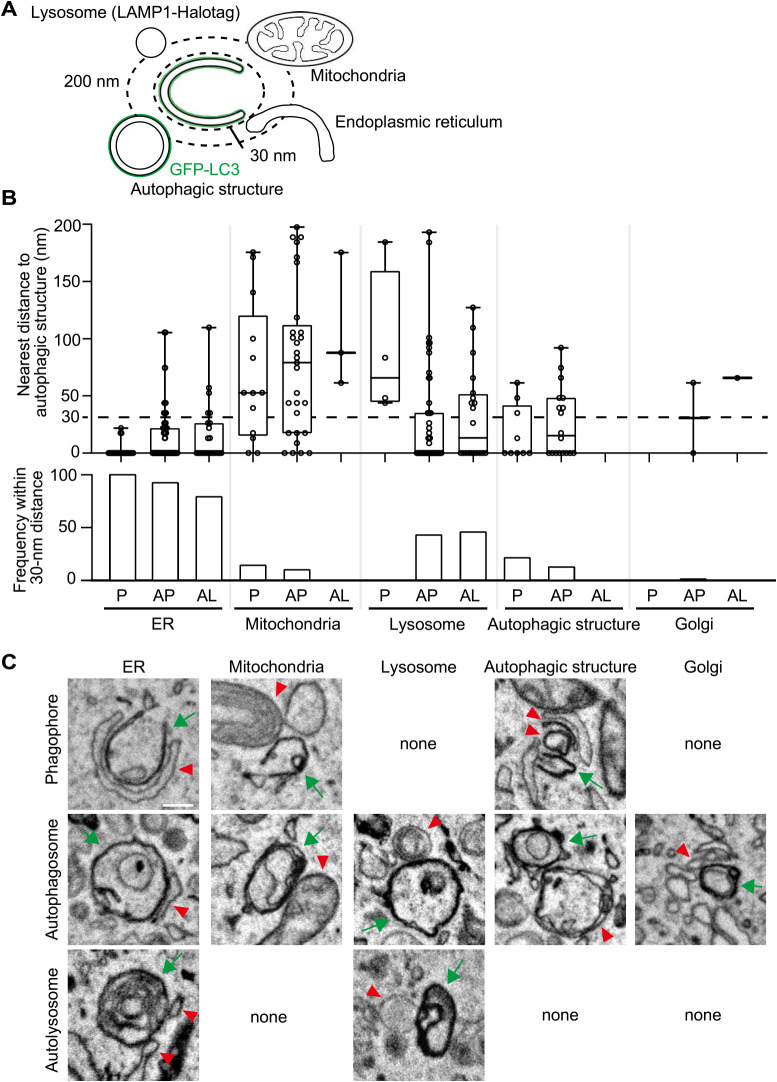
Fig. 3.
Relationship between autophagic structures and other organelles
(A) The nearest distance between autophagic structures and other organelles was measured in 3D-EM images. The autophagic structures (GFP-LC3 positive) and lysosomes (LAMP1-Halotag positive) were identified in 3D-CLEM images. Other organelles were identified based on their morphology. (B) From two MEFs, 28 phagophores, 79 autophagosomes, and 24 autolysosomes were collected. The upper graph indicates the nearest distance between autophagic structures and other organelles. The distance was measured when the organelle localized within 200 nm. The dotted line indicates a 30-nm distance. In the box plots, solid bars indicate medians, boxes indicate the interquartile range (25th to 75th percentile), and whiskers indicate the largest and smallest values. The lower graph indicates the frequency for each organelle observed within a 30-nm distance from autophagic structures. P, phagophore; AP, autophagosome; and AL, autolysosome. (C) Representative EM images of autophagic structures in contact with other organelles. Green arrows indicate phagophores, autophagosomes, or autolysosomes. Red arrowheads indicate the organelles in contact with the autophagic structures. Scale bar, 0.2 μm.

