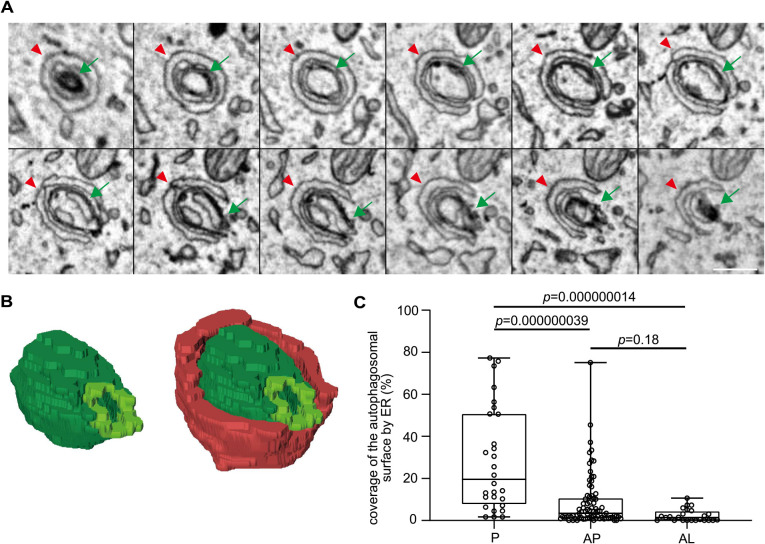
Fig. 4.
Gradual detachment of the ER from autophagosomes and autolysosomes
(A) Serial EM images showing the ER contacting the rim and the outer and inner membranes of a phagophore. Green arrows indicate a phagophore and red arrowheads indicate the ER. Scale bar, 0.2 μm. (B) 3D reconstruction of the images in (A). Green indicates the phagophore, yellow green indicates the rim of the phagophore, and red indicates the ER in contact with the phagophore (74% of the autophagosomal surface is covered by ER in this example). (C) Percentages of the autophagosomal outer surface area in contact with the ER. The percentages were calculated based on serial EM images of whole autophagic structures. The contact sites were defined as the areas where the ER and autophagic membranes were present within 30 nm. P, phagophore; AP, autophagosome; and AL, autolysosome. Solid bars indicate medians, boxes indicate the interquartile range (25th to 75th percentile), and whiskers indicate the largest and smallest values. Differences were statistically analyzed by one-way ANOVA and Tukey’s multiple comparison test.

