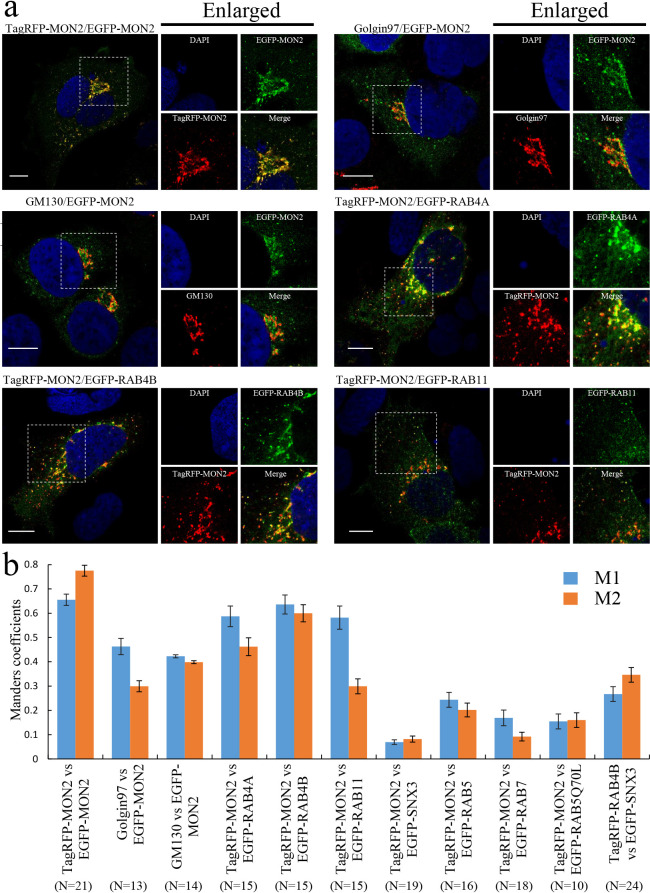
Fig. 2.
Subcellular localization of MON2. a, Representative confocal images of MON2. HEK293 cells were transiently transfected with constructs for expression of fluorescent-tagged proteins. Endogenous Golgin97 and GM130 were immunostained as Golgi markers. Enlarged images show magnified views of the boxed areas. Scale bars, 10 μm. b, Quantitative analysis of protein co-localization. MCCs between two proteins were calculated using the ImageJ plugin JACoP. M1 represents the fraction of the red channel that overlapped with the green channel. M2 represents the fraction of the green channel that overlapped with the red channel. The data represent means±SE of the measurements. The numbers of cells used in the calculations are indicated in the parentheses.

