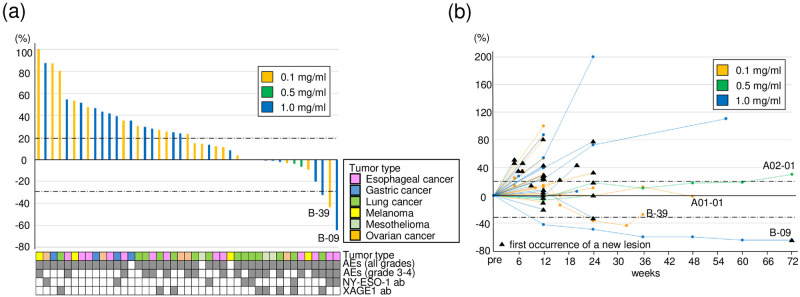
Fig 2. Characteristics of clinical responses.
(a) A Waterfall plot for the best percentage change from baseline. A positive change in the tumor burden indicates tumor growth, while a negative change reflects a tumor reduction. The tumor type, presence or absence of adverse events, and presence or absence of NY-ESO-1 and XAGE1 antibody responses are annotated for each patient. (b) A Spaghetti plot for the percentage change in the target lesion tumor burden from baseline over time. Tumor burden was measured as the sum of the longest diameters of the target lesions by patients over time. The black triangle indicates the first occurrence of a new lesion. Horizontal dotted lines denote a 30% decrease and a 20% increase. 0.1 mg/ml (n = 23), blue bar; 0.5 mg/ml (n = 3), green bar; 1.0 mg/ml (n = 23), orange bar.

