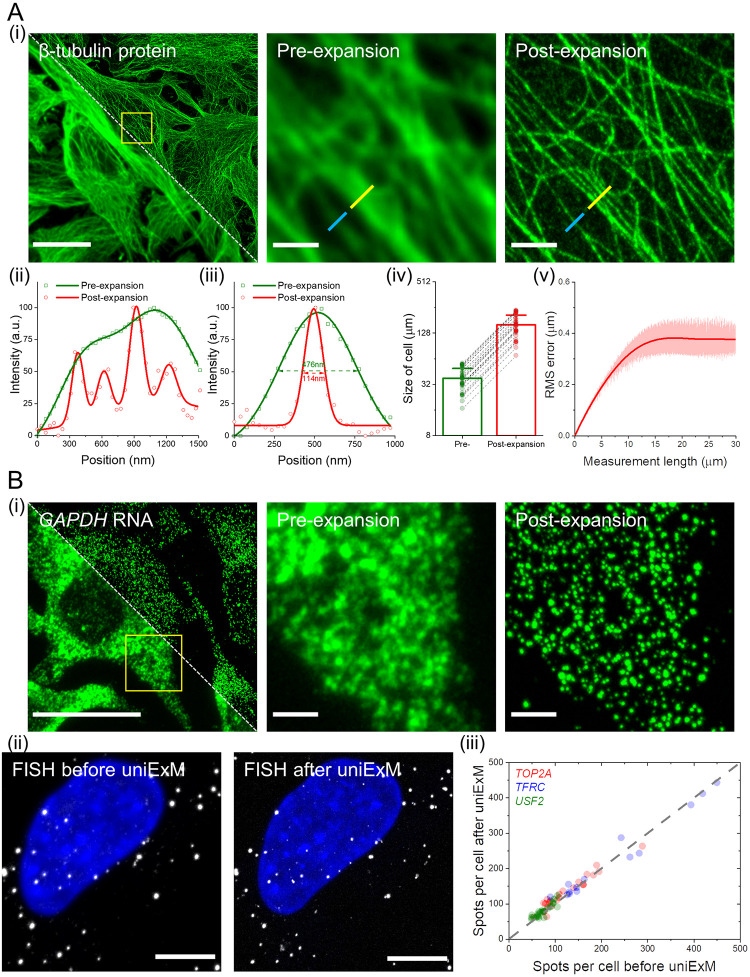
Fig 2. Characterization of GMA-based uniExM for protein and RNA retention.
(A) uniExM improves imaging resolution and achieves homogenous expansion. (i) Representative images of HeLa cells stained with β-tubulin antibody (pre-expansion staining) are shown. Upon expansion, resolution improvement, expansion factor and distortion were evaluated. Left image: pre-expansion (lower left half) and post-expansion (upper right half) fields of view of the same specimen, where the white diagonal dashed line delineates the boundary between the two images. Middle and right images: zoomed-in view of the region highlighted by the yellow square in the left image. Scale bars (in pre-expansion units): 20 μm (left image), 2 μm (middle and right images). Panels (ii) and (iii) plot the cross-section intensity profiles along the yellow and blue lines, respectively, in the zoomed-in images of panel (i). The raw intensity values (shapes) were fitted with multi-peak Gaussian functions (solid lines). The values presented in panel (iii) are FWHM (full width at half maximum) of the fitted Gaussian functions. In panel (iv), long axes of the same cell were measured before and after expansion to calculate the expansion factor. The linear expansion factor was determined to be 4.2 in this demonstration (n = 30 cells from 2 different batches of culture; mean + standard deviation was presented in bar chart with raw measurements shown as individual points). In panel (v), RMS length measurement error was quantified by benchmarking post-expansion confocal images against pre-expansion super-resolution SoRa images of microtubule staining in HeLa cells (red line, mean value; shaded area, standard deviation; n = 5 samples). (B) uniExM for RNA detection and quantification. (i) GMA-based expansion helps de-crowd densely packed mRNAs and better resolve single transcripts of the highly expressed GAPDH gene in HeLa cells. Left image: pre-expansion (lower left half) and post-expansion (upper right half) images of the same specimen, where the white diagonal dashed line delineates the boundary between these two images. Middle and right images: zoomed-in view of the region highlighted by the yellow square in the left image. Scale bars (in pre-expansion units): 20 μm (left image), 2 μm (middle and right images). (ii) GMA-based uniExM effectively preserves RNA information during the expansion process. HCR-FISH targeting specific genes was performed before and after expansion. Left image: a representative image of HCR-FISH for the USF2 gene in HeLa cells. Number of transcripts per cell was counted, and then FISH probes were stripped off with concentrated formamide and heating. Right image: The same sample was subjected to uniExM, after which HCR-FISH targeting the same gene was performed and quantified. Scale bars (in pre-expansion units): 5 μm. (iii) Three genes—TOP2A, TFRC and USF2 (with the expression level ranging from ~50 to ~500 transcripts per cell)—were chosen to evaluate the RNA anchoring efficiency by GMA in uniExM. Spots/transcripts per cell counted before and after GMA anchoring were fit by linear regression, with an R-squared value of 0.9736, indicating nearly 100% RNA retention (each point in the scatter plot represents one measurement from a single cell; n = 60 cells collected from 3 culture batches).

