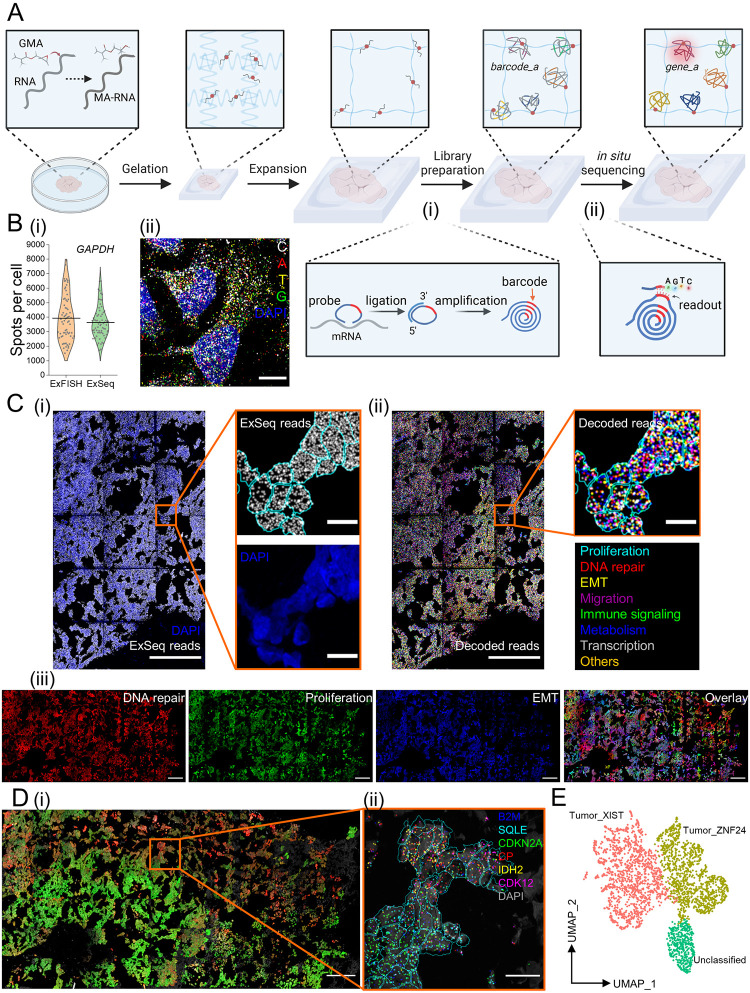
Fig 4. uniExM-supported in situ RNA sequencing (ExSeq).
(A) Schematic of the workflow for targeted ExSeq (tExSeq): target RNA molecules are reacted with GMA to acquire methacrylate groups (termed MA-RNA) and anchored to the expandable hydrogel. Padlock probes are then introduced to hybridize with the target RNAs in the expanded biological sample. Upon successful hybridization, the sequence of a target mRNA serves as a “splint” for PBCV-1 enzyme-mediated ligation of the bound padlock, as shown in the zoomed-in panel (i). Afterwards, rolling circle amplification (RCA) is applied to amplify the ligated probes that harbor barcodes specific to targets. Finally, the barcodes are read out by in situ sequencing chemistry, as shown in the zoomed-in panel (ii). The full readout of a specific barcode can then be used to reveal the gene identity (e.g., from barcode_a to gene_a) together with its location information. In such way, multiple gene targets can be decoded (represented as differentially colored amplicons). (B) Validation of ExSeq enzymatics and sequencing-by-synthesis (SBS) chemistry in samples processed with the uniExM procedure. (i) GAPDH in HeLa cells was chosen to undergo HCR-FISH or tExSeq. The numbers of detected signal spots per cell were quantitatively compared. No statistically significant difference was observed between the two methods. (Data shown as violin plots, with raw data points presented, and mean values highlighted with solid lines; n = 70 cells from 4 samples, 2 culture batches; two-sample t-test was performed with p > 0.1) (ii) A fluorescence image showing raw ExSeq signals from all four base channels in HeLa cells undergoing targeted ExSeq. Scale bars (in pre-expansion units): 20 μm. (C) Demonstration of ExSeq applying an 87-gene panel in GMA-anchored SA501 PDX breast cancer tissue. (i) Overview of the raw ExSeq reads (gray spots) in the tissue. DAPI staining for nuclei was used for cell segmentation and reads assignment (shown in the zoomed-in images). (ii) The raw ExSeq reads were decoded and colored based on 8 distinct gene function groups (full list in S5 Table in S1 File). Scale bars (in pre-expansion units): 100 μm (for stitched overview images), 10 μm (for zoomed-in images). (iii) Gene maps of 3 selected function groups—DNA repair, proliferation and epithelial-mesenchymal transition (EMT), were used to help visualize heterogeneity of cell status in the whole tissue. The decoded transcripts of genes belonging to each functional group were summed and their ratio to total transcript counts were assigned to the “R”, “G”, “B” color channels of the image, respectively. During the color assigning process, a scaling factor of 3.33 (for DNA repair and proliferation) or 2.5 (for EMT) was introduced; that is, if the EMT group of genes was 40% of the total transcripts in one cell, its assigned “B” channel was given the maximum color intensity (40% X 2.5 = 100%). Then, the three individual channels were combined to make a composite image (right). Scale bars (in pre-expansion units): 100 μm. Linear expansion factor: 3.2 (the expanded gel was re-embedded before sequencing). (D) Unsupervised principal component analysis (PCA) identified two primary gene groups for cell classification. (i) Using these two PCA gene groups, a distribution of different cancer cells was revealed. In this presented image, the summed transcripts of each PCA group normalized to the total transcript count for a given cell were assigned to the “R” channel and “G” channel, respectively (scaling factor: 3.33). Then the two images were overlaid to make a composite. Scale bar (in pre-expansion units): 100 μm. (ii) In the zoomed-in region where differentially colored cells co-exist, 6 marker genes are plotted; their distribution varies across cells in the subregion. Scale bar (in pre-expansion units): 10 μm. (E) Uniform manifold approximation and projection (UMAP) representation of the cell typing results using bulk RNA-seq identified marker genes in the SA501 cancer model. According to the panel design, the 87 gene list could differentiate two primary cancer cell clones that are successfully annotated on UMAP—“Tumor_XIST” and “Tumor_ZNF24”, named after their feature genes. A small group of cells are marked as “Unclassified”, likely attributed to non-cancer interstitial or other cells.

