Figure 1.
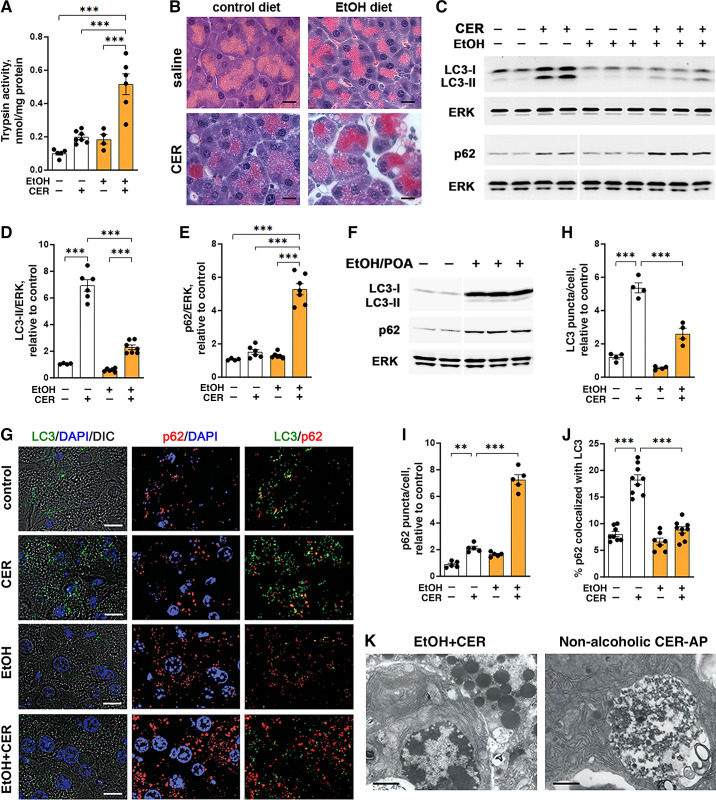
LC3-II level and the number of autophagic vacuoles in pancreas are reduced in mouse models of alcoholic pancreatitis, compared with no-alcohol conditions. A–E, G–K: in EtOH+CER model of alcoholic pancreatitis, mice were fed Lieber-DeCarli ethanol-containing or isocaloric control diet for 6 wk followed by 7 hourly intraperitoneal injections of 5 µg/kg (low-dose) cerulein (CER) or saline. In the EtOH/POA model (F), mice received 2 hourly intraperitoneal injections of 1.35 g/kg ethanol plus palmitoleic acid (POA; 150 mg/kg). The nonalcoholic CER-AP (K) was induced by 7 hourly intraperitoneal injections of 50 µg/kg (high-dose) CER in mice on standard chow. Details on the animal models are given in experimental procedures. A: trypsin activity in pancreas was measured with a fluorogenic enzymatic assay. B: histopathological changes in pancreas were assessed by H&E staining; scale bars, 10 µm. C and F: IB analysis of pancreatic LC3 and p62/SQSTM1 levels. In this and other figures, ERK1/2 is the loading control; each lane represents an individual animal; a narrow white space indicates that the lanes are on the same gel but not contiguous. D and E: densitometric IB band intensities for LC3-II and p62 in the EtOH+CER model were normalized to that of ERK in the same sample, and the mean ratios further normalized to that in control (i.e., no EtOH, no CER) group. G–J: IF analysis of LC3 (green) and p62 (red) in pancreas. Nuclei were stained with DAPI (blue); differential interference contrast (DIC) microscopy was used to display zymogen granules area in acinar cells. Scale bars, 10 µm. The numbers of LC3- and p62-positive puncta were expressed per number of nuclei (DAPI) in the field and further normalized to those in control group. Colocalization of p62 with LC3 was analyzed using Manders-Costes coefficient (Volocity image analysis software). At least 700 acinar cells were analyzed for each animal. K: electron micrographs of pancreas of mice from indicated AP models. Scale bars, 2 µm. Values are means ± SE. In A, D, and E, each symbol represents an individual mouse (n = 3–7 mice/condition). In H–J, each symbol corresponds to 20–30 cells in a different field (n = 4–9 fields from 3 mice/condition). **P < 0.01; ***P < 0.001. Significance was determined by one-way ANOVA followed by Tukey’s multiple comparison test. DAPI, 4′,6-diamidino-2-phenylindole; ERK, extracellular signal-regulated kinase; EtOH, ethanol; IB, immunoblot; LC3, microtubule-associated protein-1 light chain 3.

