Figure 6.
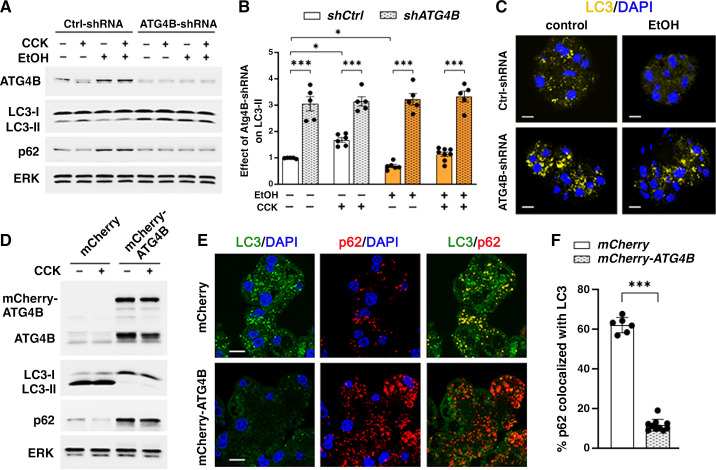
ATG4B overexpression reduces LC3-II in acinar cells, whereas ATG4B knockdown restores autophagosome formation in EtOH+CCK ex vivo pancreatitis. Mouse pancreatic acinar cells were transduced with adenoviral vectors expressing shRNA against ATG4B (ATG4B-shRNA) or control (“scrambled”) shRNA (Ctrl-shRNA); or vectors bearing mCherry-ATG4B or mCherry alone (with no transgene). Cells were incubated for 4 h with and without 100 mM EtOH; 100 pM CCK was added to the cells, as indicated, for the last 30 min of incubation. A, B, and D: IB analysis of indicated proteins. Densitometric quantification of LC3-II band (B) was done as described in Fig. 1; values were normalized to control (i.e., untreated cells transduced with control shRNA). C, E, and F: immunostaining for LC3 and p62; nuclei stained with DAPI. Scale bars, 10 µm. p62 co-localization with LC3 (F) was quantified using Manders-Costes coefficient (Volocity software). Values are means ± SE from five to nine acinar cell preparations; each symbol represents an individual cell preparation (B) or at least 150 cells assessed for p62 colocalization with LC3 (F). *P < 0.05, ***P < 0.001; one-way ANOVA with Tukey’s multiple comparison test (B) or two-tailed Student’s t test (F). CCK, cholecystokinin; DAPI, 4′,6-diamidino-2-phenylindole; EtOH, ethanol; IB, immunoblot; LC3, microtubule-associated protein-1 light chain 3.

