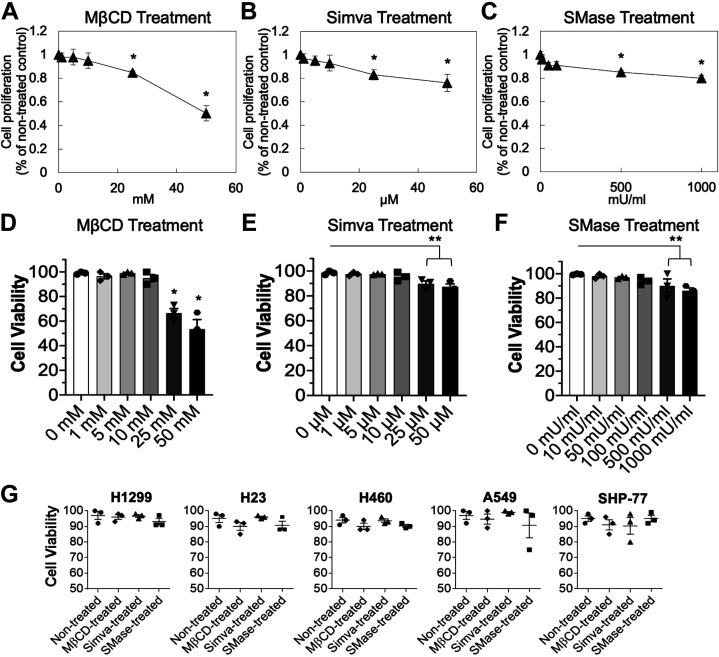
Figure 1.
MTS cell proliferation and viability assays. H1299 cells were treated with various concentrations of MβCD for 30 min (A), Simva for 20 h (B), or SMase for 20 min (C). Cell proliferation was tested by MTS assay. Results are the means ± SE over n = 3 independent experiments. Statistical analysis was performed via one-way ANOVA with Tukey’s HSD post hoc test. *Significant difference from other concentrations (P < 0.05). D–F: using the trypan blue assay, the cell viability of H1299 cells was tested for different concentrations of MβCD for 30 min, Simva for 20 h, and SMase for 20 min. Results are the means ± SE over n = 3 independent experiments. Statistical analysis was performed via one-way ANOVA with Tukey’s HSD post hoc test. *Significant difference from the other concentrations, and **Significant difference from the rest of the concentrations but not between each other (P < 0.05). G: using the trypan blue assay, the viability of all lung cancer cell lines was tested upon treatment with 10 mM of MβCD for 30 min, 10 µM of Simva for 20 h, or 100 mU/mL of SMase for 20 min. Results are the means ± SE over n = 3 individual experiments. HSD, honest significant difference; MβCD, methyl-beta-cyclodextrin.

