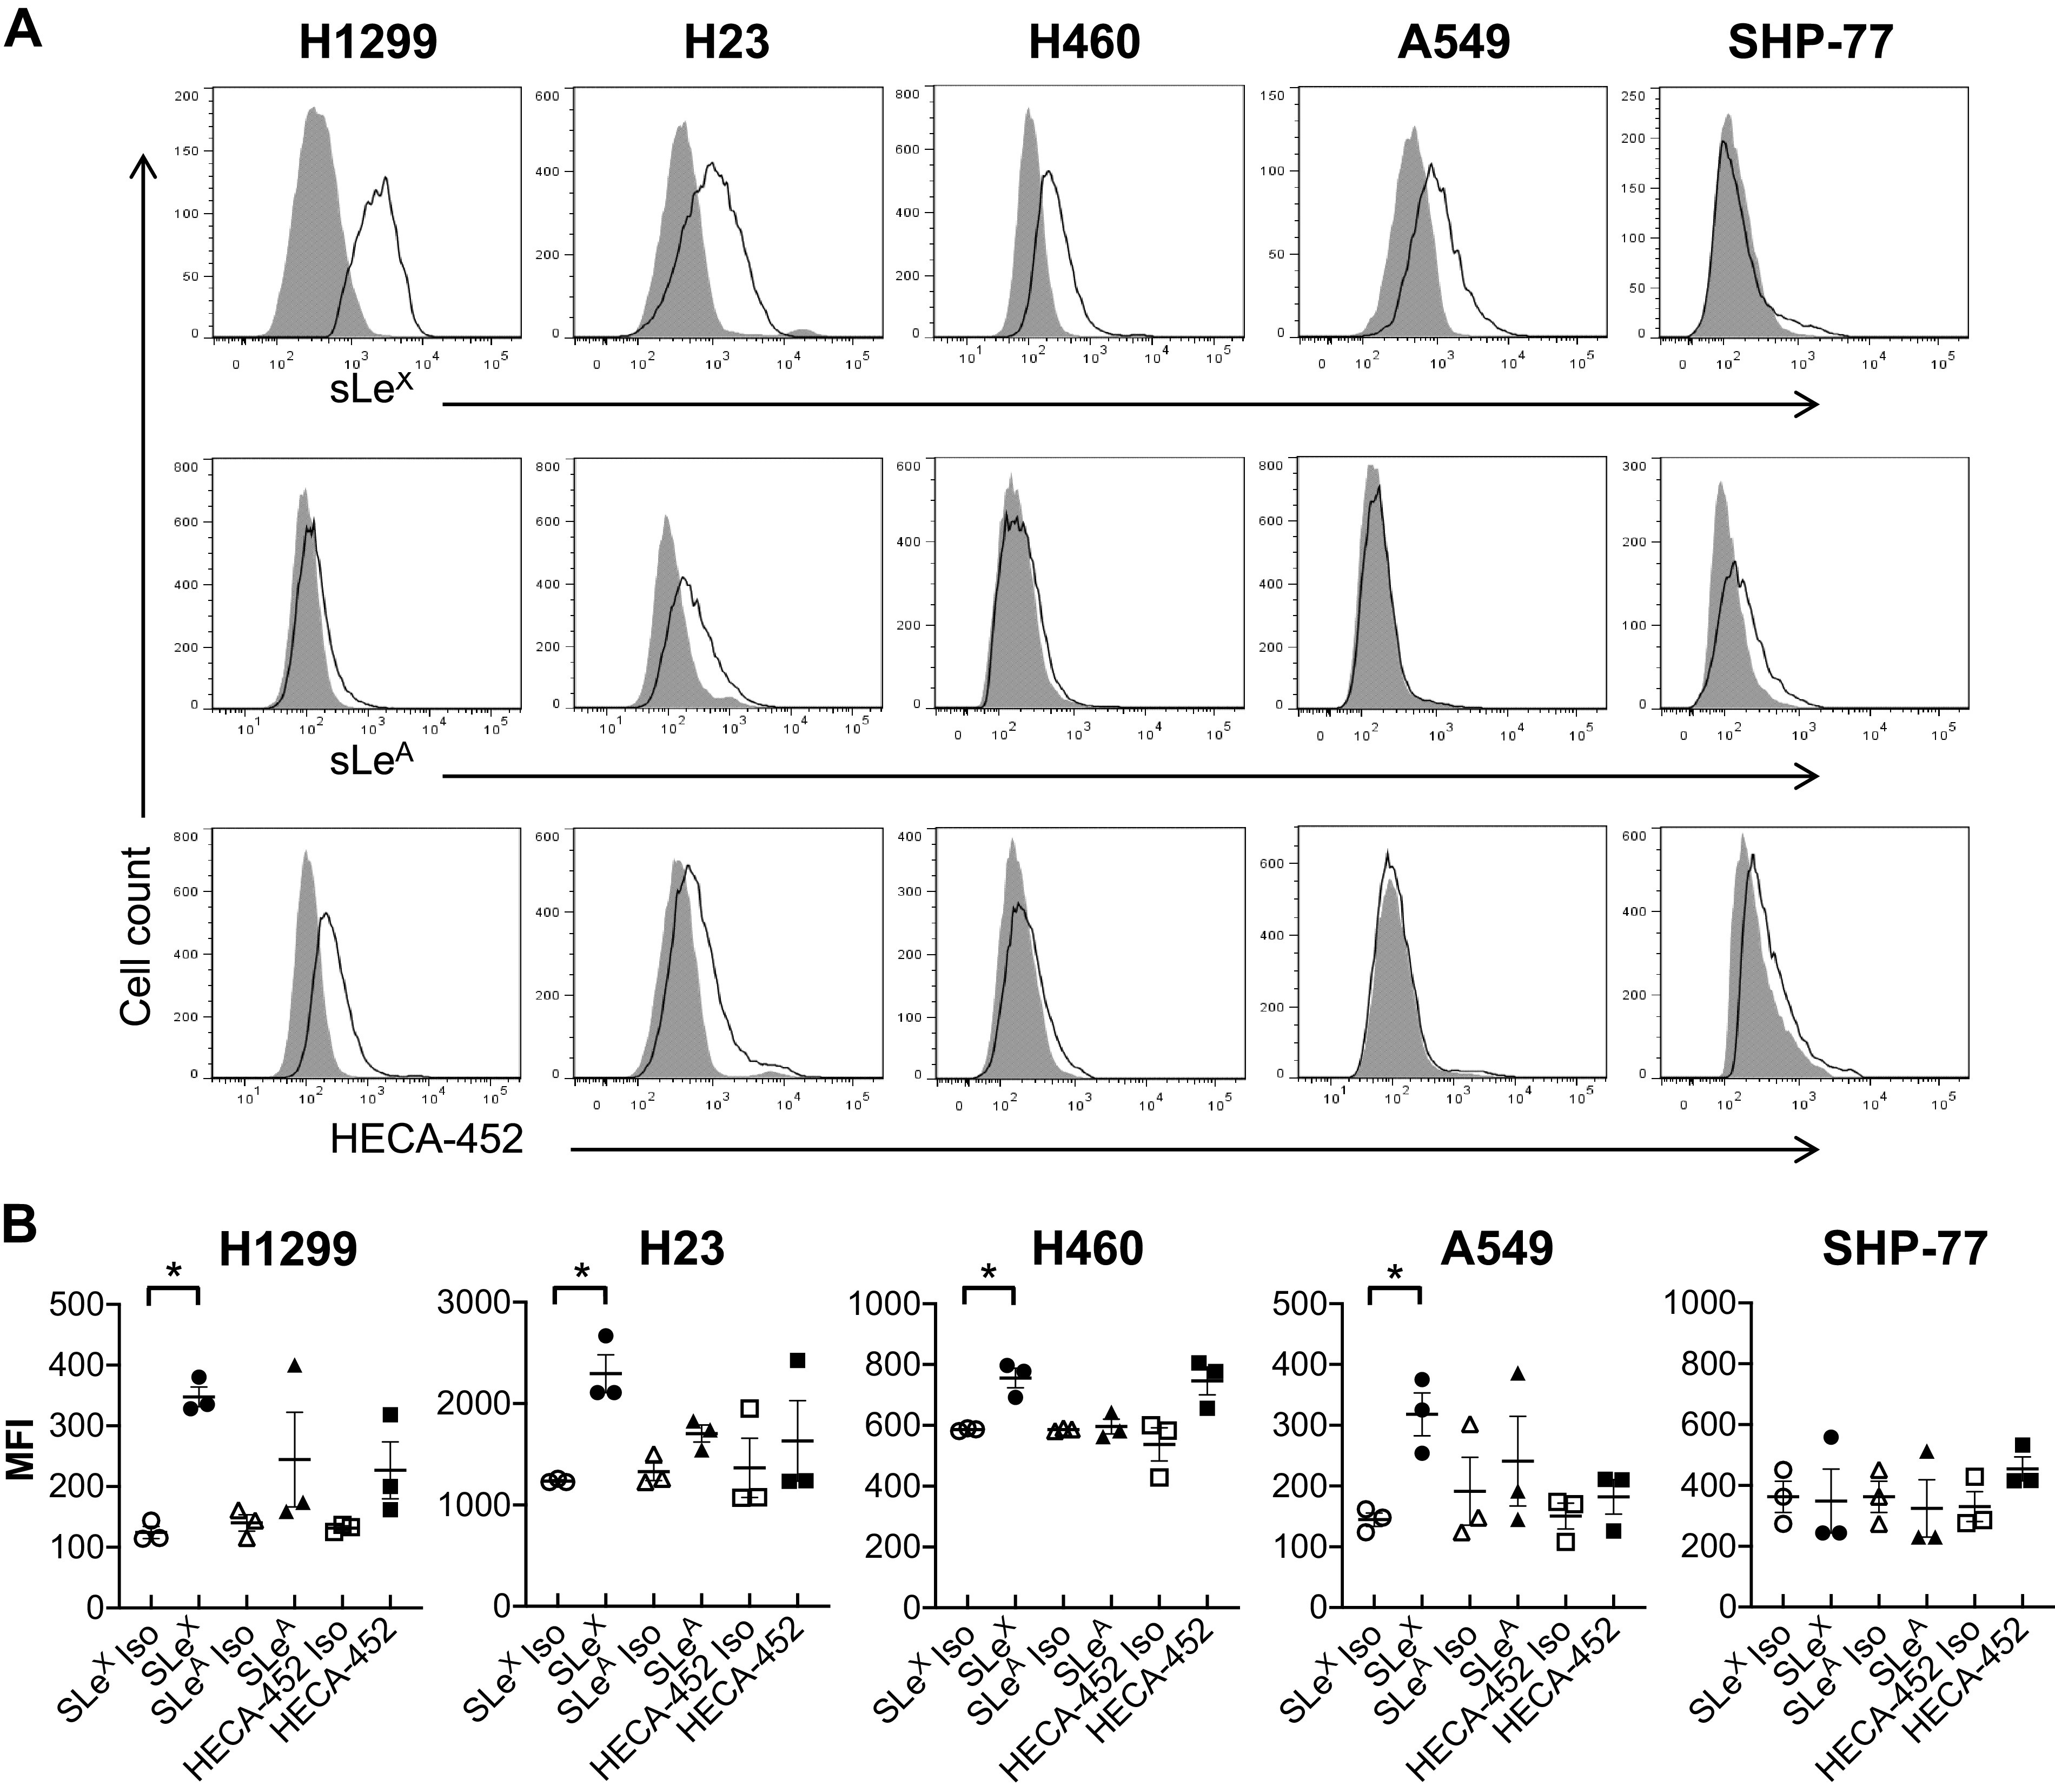
Figure 3.

Lung cancer cells were probed for a variety of known selectin ligand epitopes via flow cytometry. A: histograms are representative of n = 3 independent experiments. Isotype control is represented by the filled region, whereas specific antibody expression is shown with unfilled lines. B: statistical analysis of the mean fluorescence intensities (MFIs) showed that all NSCLC cell lines were strongly positive for sialofucosylated sLeX. Only H23 weakly expressed sLeA, and only H1299 and H23 weakly expressed HECA-452 reactive epitopes. Values are means ± SE for n = 3 independent experiments. Statistical analysis was performed by one-way ANOVA with Tukey’s HSD post hoc test comparison. *Statistical significance compared with the relative isotype control (P < 0.05). HSD, honest significant difference; NSCLC, non-small cell lung cancer.
