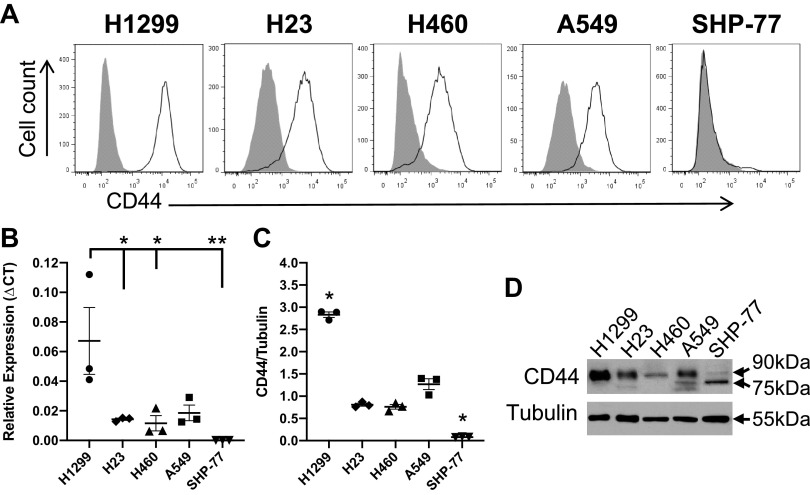
Figure 5.
Lung cancer cells were probed for CD44. A: cancer cells were labeled with anti-CD44 (2C5) mAb (open curves) or isotype control (filled curves) and analyzed by flow cytometry. All cell lines, except for the SHP-77, positively expressed CD44. B: qRT-PCR was performed on H1299, H23, H460, A549, and SHP-77 mRNA using primers designed for the detection of CD44 standard. Data were analyzed using the Pfaffl method and presented as relative expression compared with the ribosomal protein L13A (RPL13A) housekeeping gene. CT is the threshold cycle. Data shown are means ± SE of n = 3 independent experiments with three technical replicates per experiment. Statistical analysis was performed by one-way ANOVA with Tukey’s HSD post hoc test. *P < 0.05 vs. H1299 (P = 0.035 for H23, P = 0.026 for H460). **P < 0.01 vs. H1299 (P = 0.008 for SHP-77). The results for all other comparisons were above the significance threshold (P < 0.05). C: cell lysate from 106 cells was blotted with anti-CD44 (2C5) mAb. Tubulin loadings were used as controls for cell lysates. Data are representative of n = 3 independent experiments. Statistical analysis was performed by one-way ANOVA with Tukey’s HSD post hoc test comparison. *Significant differences compared with the other cell lines (P < 0.05). D: representative blot corresponding to C. HSD, honest significant difference.

