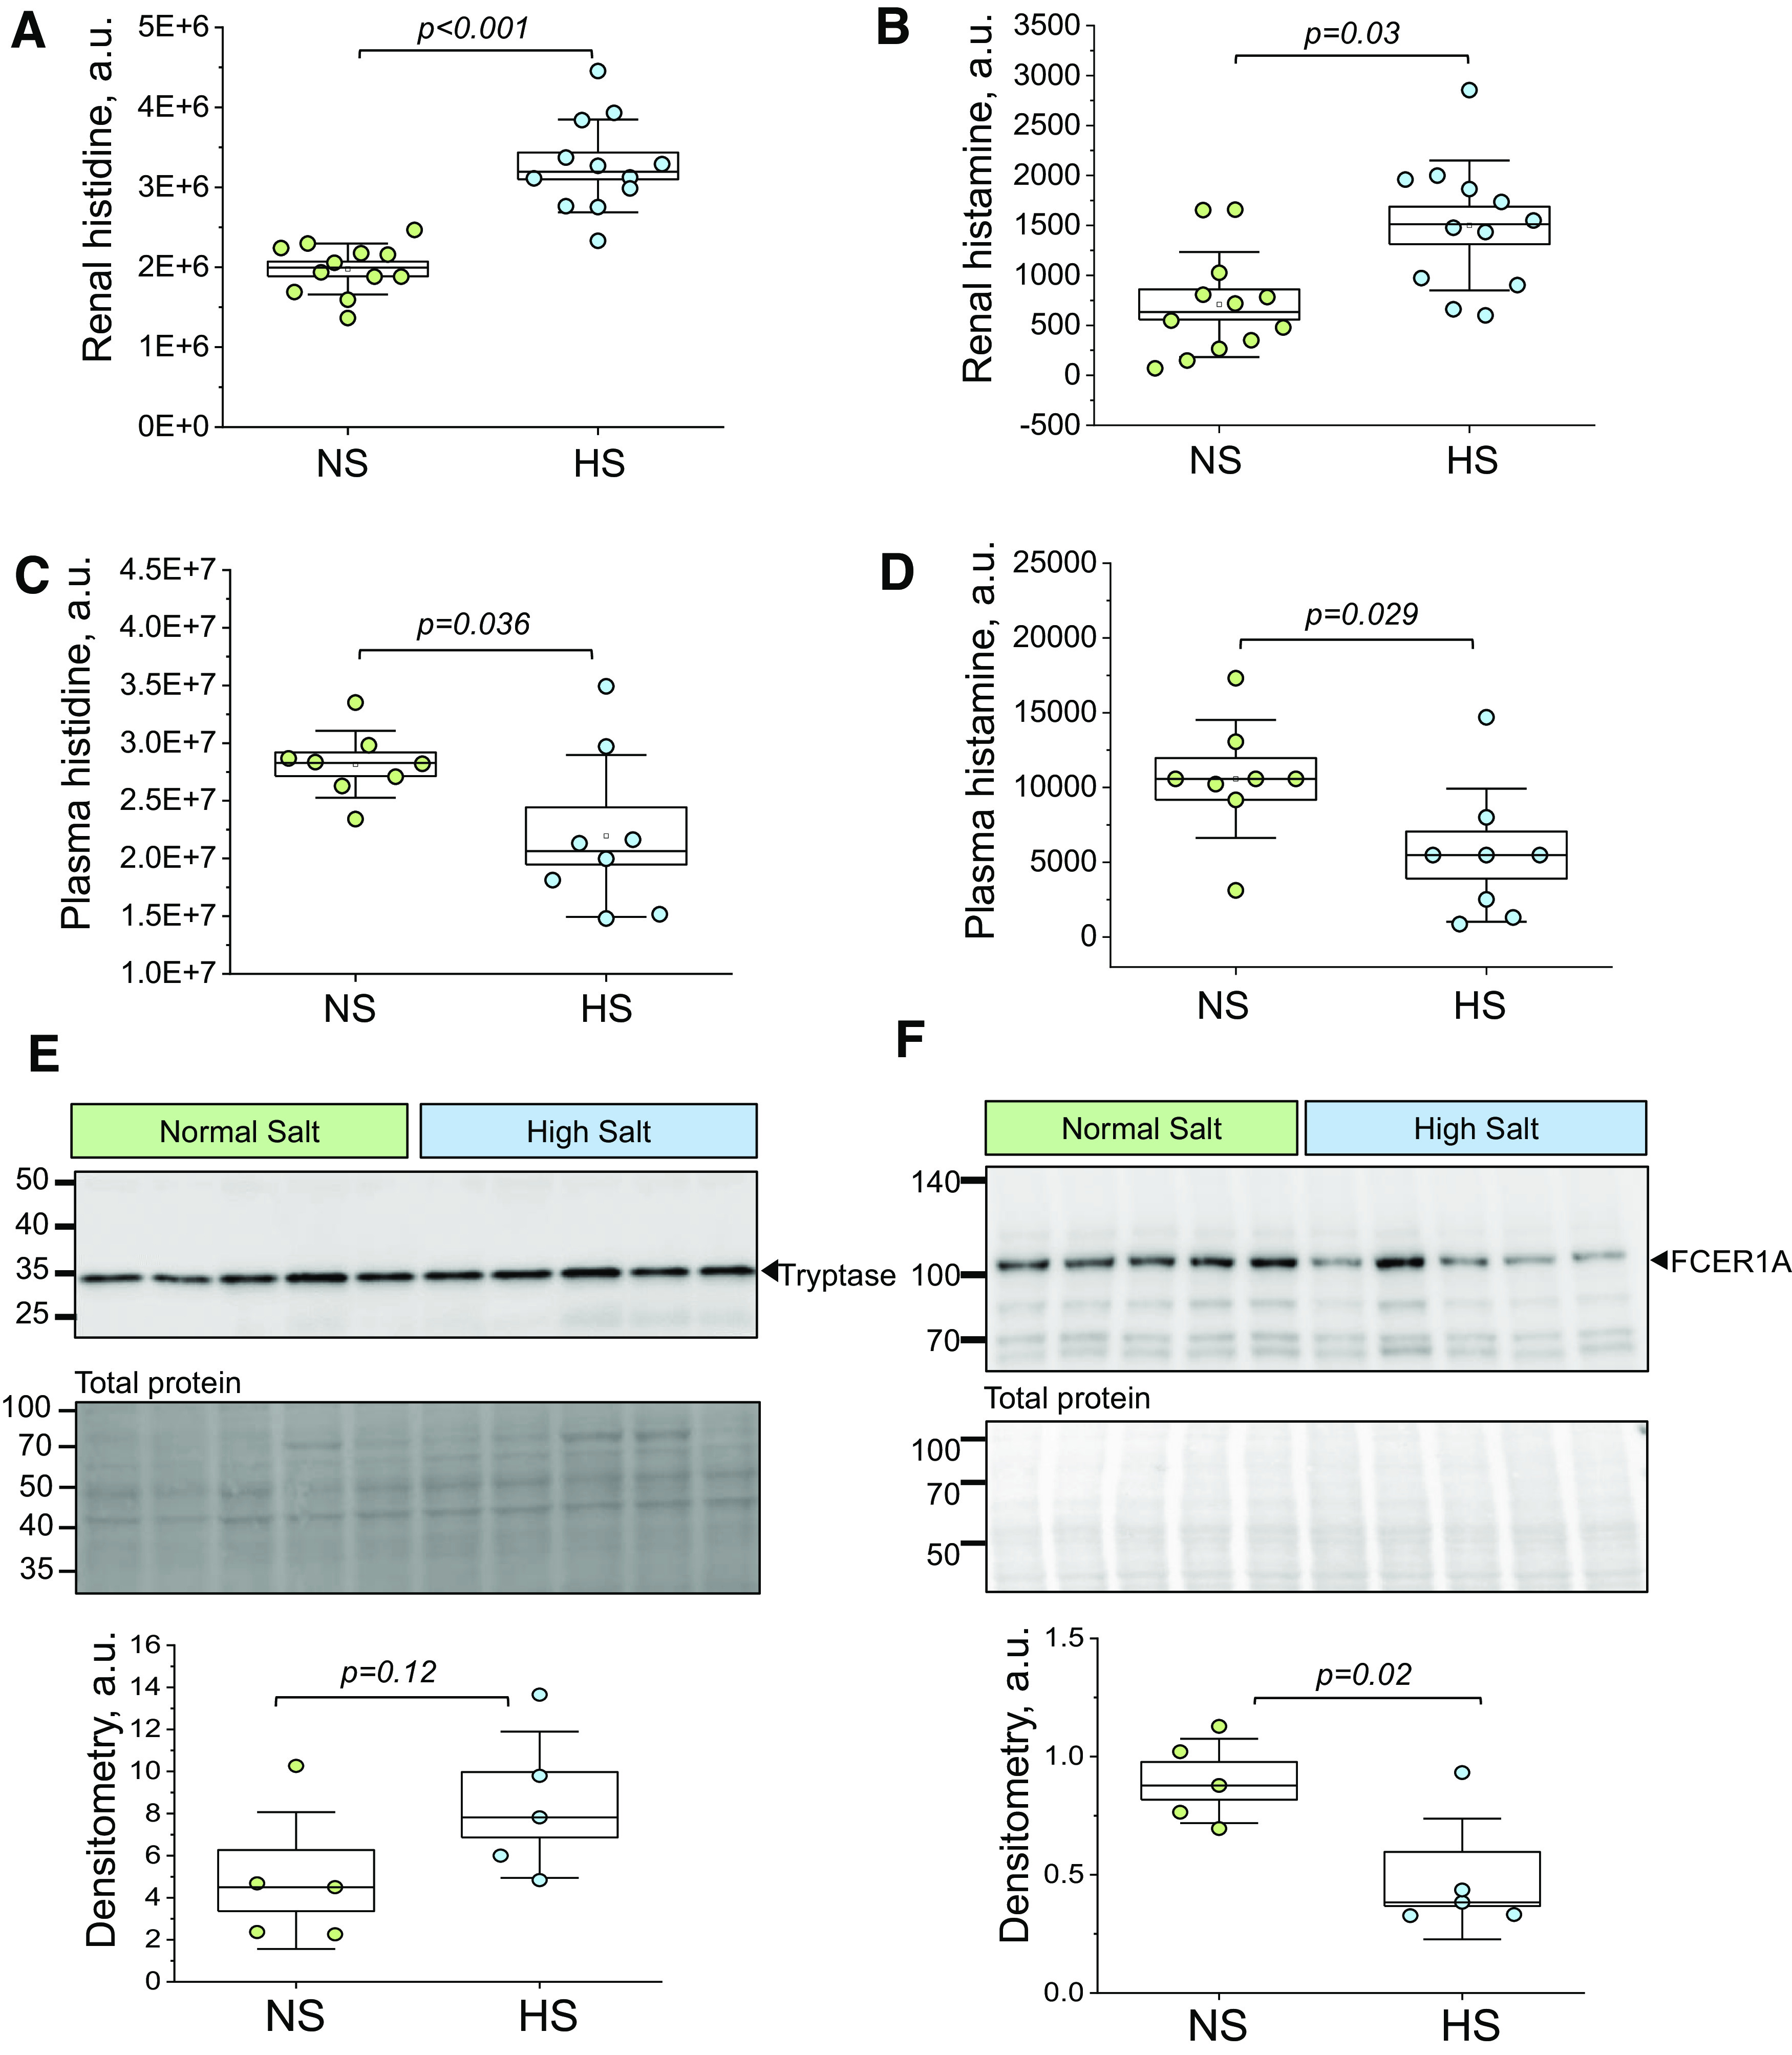
Figure 5.

Renal and plasma levels of histamine, histidine, and expression of mast cell markers in Dahl salt-sensitive (DSS) rats. A and B: levels of histidine (A) and histamine (B) obtained with mass spectrometry in renal tissues from normal-salt (NS) and high-salt (HS) diet-fed DSS rats; n = 12 per diet group. C and D: levels of histidine (C) and histamine (D) obtained with mass spectrometry in plasma from NS and HS diet-fed DSS rats; n = 8 per diet group. E and F, top: representative Western blot images probing for mast cell markers [tryptase (E) and Fc fragment of the high-affinity IgE receptor α-polypeptide (FCER1A; F)] Ponceau-stained membranes (total protein) are shown below the probed membranes. E and F, bottom: densitometric analysis for tryptase (E) and FCER1A (F) membranes; n = 5 per diet group. Boxes indicate means ± SE; whiskers are SDs. One-way ANOVA with a Holm-Sidak post hoc test was used for statistical analysis; a.u. arbitrary units.
