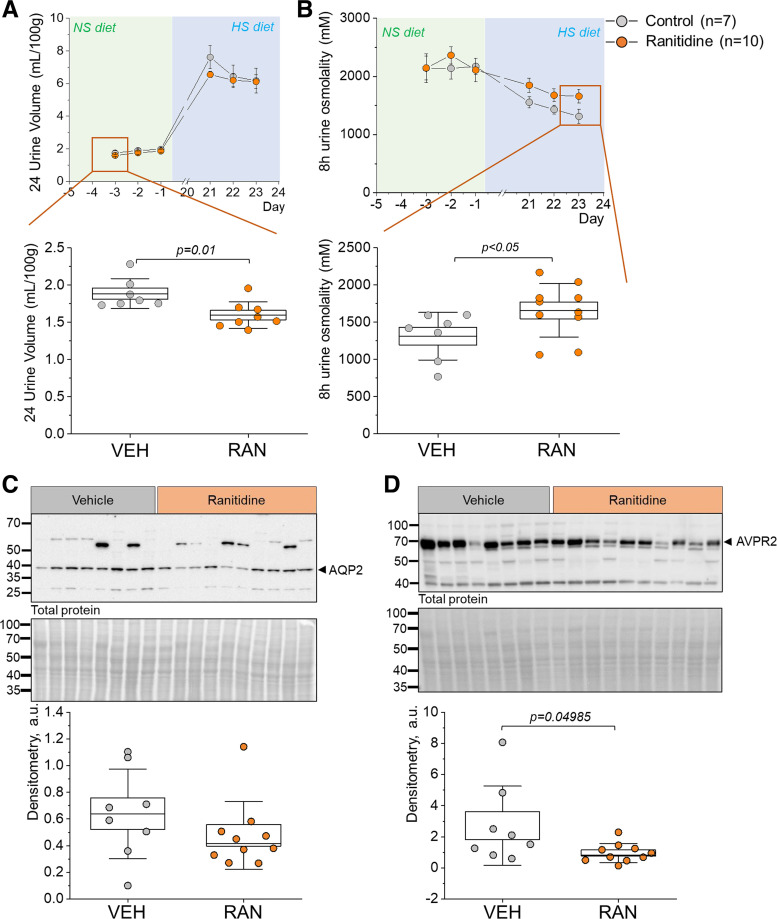
Figure 8.
Changes in urine volume and osmolality in ranitidine (RAN)-treated Dahl salt-sensitive rats. A and B, top: line and symbol graphs highlighting the 3 days of RAN treatment on normal-salt (NS; day −3 to day −1) and high-salt (HS; day 21 to day 23) diets in Dahl salt-sensitive rats. Orange circles represent the RAN-treated group; light gray circles represent the vehicle (VEH)-treated group. A and B, bottom: box plots emphasize the first day of treatment while on the NS diet and the last day of treatment while on the HS diet, respectively. C and D, top: representative Western blots probed for aquaporin 2 (AQP2; C) and the type 2 arginine vasopressin receptor (AVPR2; D) in HS diet-fed animals (top) with the Ponceau-stained membrane representing total protein shown below the antibody-probed membrane. C and D, bottom: densitometric analysis of the Western blots; n = 7–8 for VEH treatment and 8–10 for RAN treatment. Boxes indicate means ± SE; whiskers are SDs. Repeated-measures ANOVA with a Holm-Sidak post hoc test was used for statistical analysis; a.u. arbitrary units.

