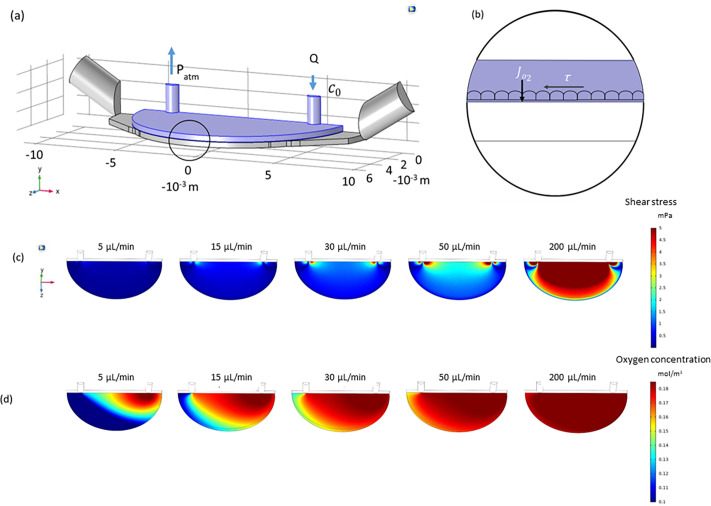
FIG. 2.
Computational fluid dynamic simulations. (a) The simulations were run on the apical chamber (blue) by solving the Navier–Stokes equation. Different flow rates from 5 to 200 μl/min were tested. (b) To calculate oxygen concentrations, the mass transport equation was implemented setting the oxygen concentration at the inlet and a known, constant oxygen flow rate (JO2) was imposed at the membrane. (c) Shear stress at the membrane level considering different flow rates. (d) Oxygen concentration at the membrane level considering different flow rates.

