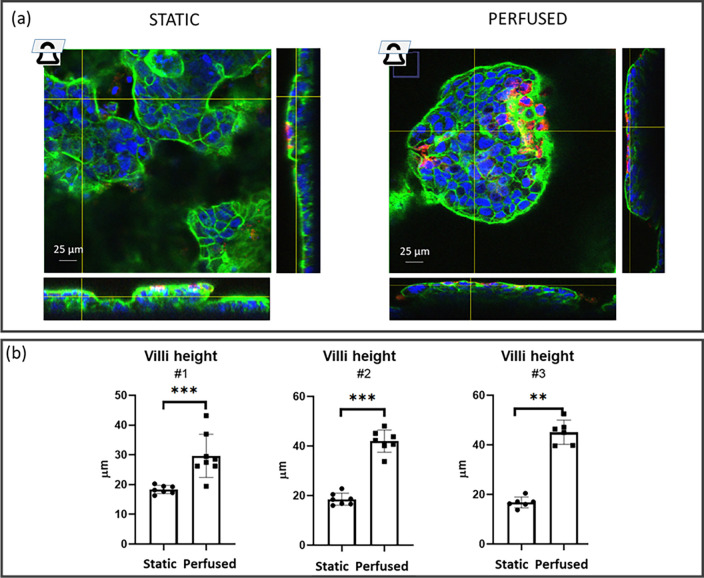
FIG. 4.
Epithelial height. (a) Epithelial height was calculated using orthogonal views of immunofluorescence images (F-actin in green, DNA in blue, and mucin-2 in red) acquired with a confocal microscope, taking the highest and lowest actin layers in each image. (b) Epithelial height was analyzed on three independent experiments (#1, #2, and #3) for static and perfused samples. For each experiment, at least four different images were acquired. Each image corresponds to a dot in the plot. Mann–Whitney U-test, **p < 0.01; and ***p < 0.001.

