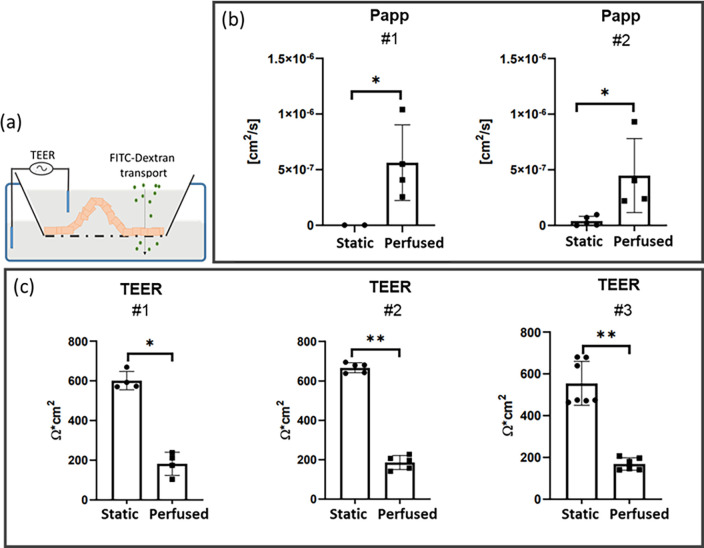
FIG. 6.
Gut epithelial barrier function. (a) Graphic representation of TEER and FITC-dextran permeability. (b) Apparent permeability (Papp) was tested twice (#1, #2). Each experiment involved at least four samples for each static and perfused condition. * = p < 0.05, Mann–Whitney (MW) U-test. (c) TEER was measured three times (#1, #2, and #3). Each experiment involved at least four inserts for each static and perfused condition. *p < 0.05, **p < 0.01, Mann–Whitney U-test.

