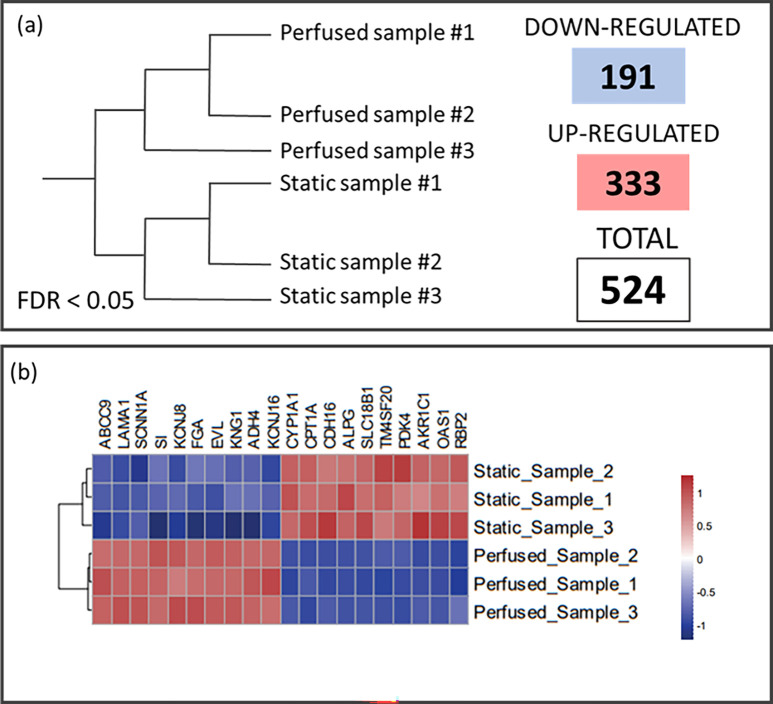
FIG. 7.
RNA sequencing analysis. (a) Graphic representation of sample clustering based on the gene differential expression. 524 genes were deregulated (333 genes upregulated and 191 genes downregulated), with FDR < 0.05. (b) The heatmap of the ten most significantly downregulated (in blue) and upregulated (in red) genes.

