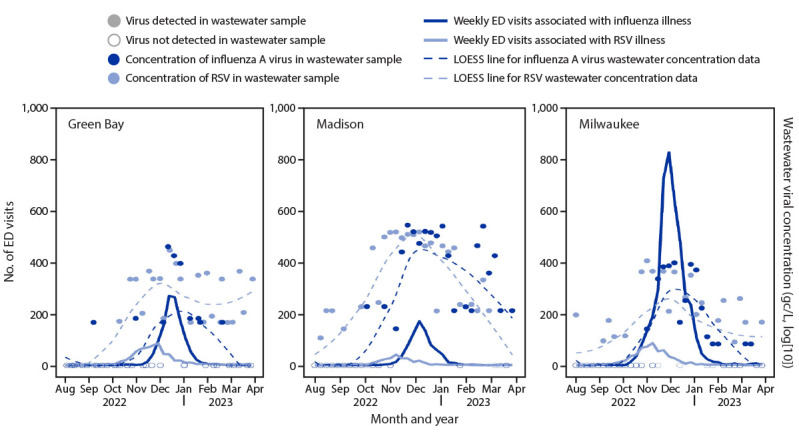
FIGURE 1.

Respiratory syncytial virus–associated and influenza-associated emergency department visits* and wastewater concentrations† for respiratory syncytial virus and influenza A virus — three Wisconsin cities, August 2022–March 2023§
Abbreviations: ED = emergency department; LOESS = locally estimated scatterplot smoothing; RSV = respiratory syncytial virus.
* Collected from the Electronic Surveillance System for the Early Notification of Community-Based Epidemics (ESSENCE) and based on CDC-provided definitions.
† Wastewater concentration values were log(10) and denoted in gene copies per L (gc/L); a value of 1 gc/L was added to all wastewater concentrations to allow for log(10) transformation of previously zero values.
§ LOESS lines are overlaid to display general trend in wastewater concentration data.
