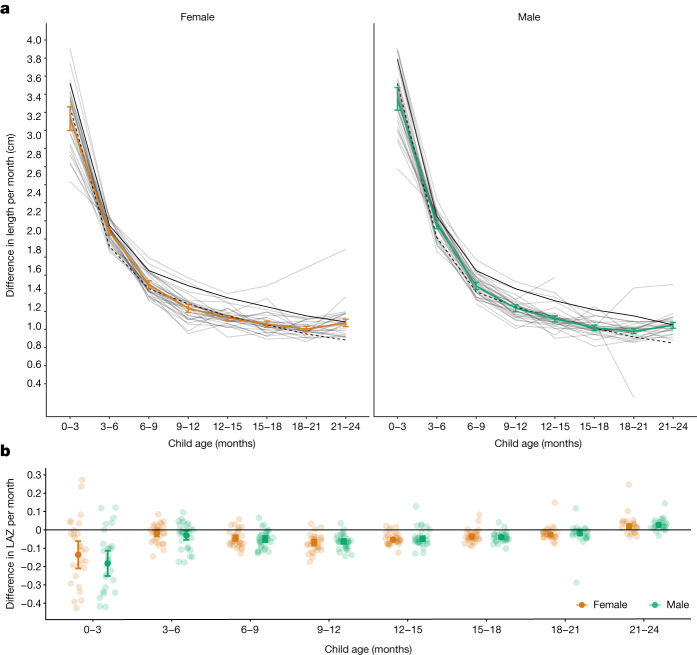
Fig. 6. Linear growth velocity by age and sex.
a, Within-child difference in length in centimetres per month stratified by age among male (green line) and female (orange line) children; 25th percentile of the WHO growth velocity standards (dashed black lines); and the 50th percentile (solid black line). Light grey lines indicate cohort-specific linear growth velocity curves. The median I2 statistic measuring heterogeneity in each meta-analysis was 90 (IQR = 83–94). b, Within-child difference in LAZ per month by age and sex. Smaller partially transparent points indicate cohort-specific estimates. The median I2 statistic measuring heterogeneity in each meta-analysis was 89 (IQR = 78–92). Both panels include 32 Ki cohorts in 14 countries that measured children at least quarterly (n = 52,640 children) pooled using random-effects models fitted with restricted maximum-likelihood estimation. Vertical bars indicate 95% confidence intervals.

