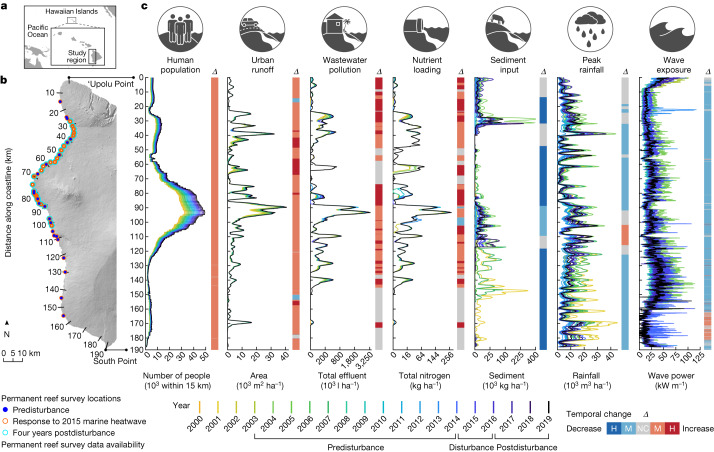
Fig. 1. Select local land–sea human impacts and environmental factors on coral reefs in our study region in Hawai‘i.
a, Geographic location of the Hawaiian Islands. b, Study region with reef surveys shown for the following: reef trajectories predisturbance (n = 23; Fig. 2), coral response to the 2015 marine heatwave (n = 80; Fig. 3) and coral reefs four years postdisturbance (n = 55; Fig. 4). c, Spatial distribution in annual, high-resolution (100 m) data on local human impacts and environmental factors from 2000 to 2019 (coloured lines). The y axis represents distance along the coastline in kilometres from north to south along the study region in b. Vertical bar represents the change over time (Δ) for each 100 m section along the coast. A change over time is high (H, Δ ≥ 50%), moderate (M, 0 > Δ < 50%) or there is no change (NC, grey), with blue hues indicating decreases and red hues indicating increases. Change is based on the mean difference between the first 5 years (2000–2004) and the most recent 5 years (2015–2019) in the time series. This accounted for year-to-year variability in the episodic nature of factors such as wave exposure, rainfall and sediment input. A subset of factors is shown in c owing to space constraints. Additional factors (not shown) include annual rainfall, phytoplankton biomass, ocean temperature (mean and variability), heat stress, irradiance, fishing gear restrictions, depth and metrics of fish biomass. The distribution, change over time and variability of all factors are shown in Supplementary Fig. 1. See Extended Data Table 1 and Supplementary Information for detailed information on local land–sea human impacts and environmental factors.

