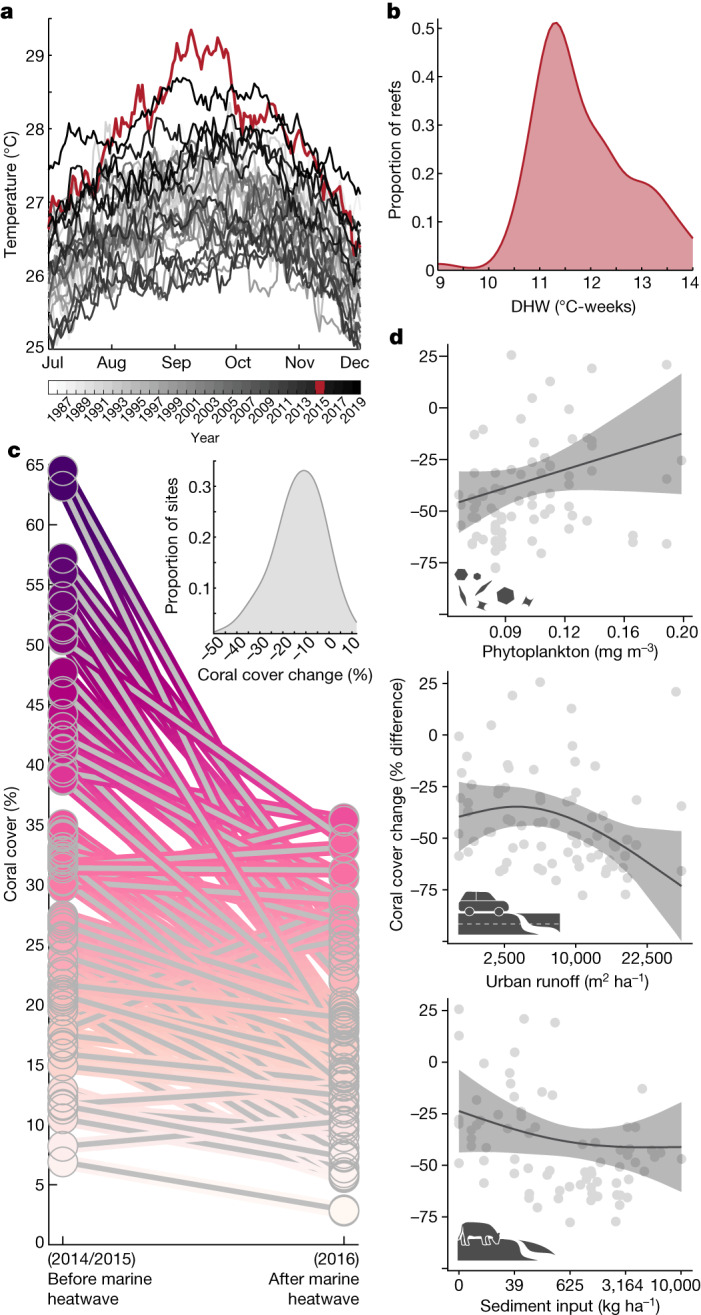
Fig. 3. Local land–sea human impacts and environmental factors that modified coral response to the 2015 marine heatwave.

a, Historical (1986–2019) SSTs during the seasonal peak (July–December) averaged across the study region; 2015 marine heatwave shown in red. b, Maximum DHW exposure in 2015, a common heat stress metric, among surveyed reefs. All reefs exceeded the eight DHW threshold expected to produce severe and widespread coral bleaching and mortality. c, Coral cover before (2014–2015) and one year following (2016) the marine heatwave among surveyed reefs (n = 80, Fig. 1b). The inset represents the distribution of absolute coral cover change. d, The GAMM results (R2 = 0.79) showing key factors explaining coral response to the marine heatwave. Change accounts for starting condition, defined as: percentage difference = ((Aa,i − Ab,i)/Ab,i) × 100, where Ab and Aa are the mean coral cover values at each reef in 2014 or 2015, and 2016, respectively (Methods and Supplementary Fig. 4). Positive and negative relationships reduce or increase coral loss, respectively. Shaded regions represent 80% confidence intervals. Factors with the strongest model averaged slopes are shown. Total fish biomass and scraper biomass were also important factors in our models but had weak slopes (representing less than 5% change; Extended Data Fig. 4). Relative importance of factors among all models (that is, sum of AICc model weights across all models containing each factor) were: sediment input (0.99), scraper biomass (0.99), total fish biomass (0.90), urban runoff (0.60), phytoplankton biomass (0.38), wastewater pollution (0.28), peak rainfall (0.20), nutrient loading (0.19), grazer biomass (0.16), DHW (0.08), wave power (0.07), depth (0.06) and fishing gear restrictions (0.05). See Extended Data Table 1 for full list of factors included in the analysis, including those removed that were highly correlated (r > 0.7, see Methods and Supplementary Fig. 5). See Supplementary Fig. 6 for predictor variable distributions.
