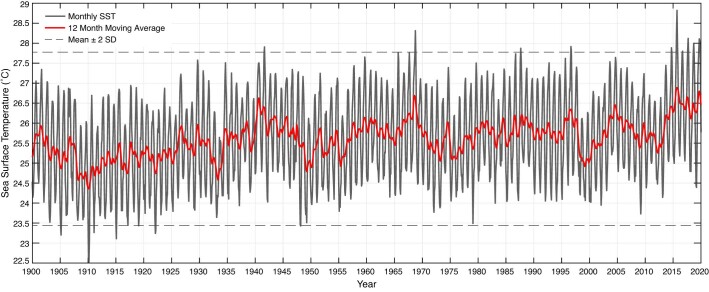
Extended Data Fig. 2. Long-term ocean temperature record for Hawai‘i.
Monthly sea surface temperature (SST) for the main Hawaiian Islands from 1900–2020. Dashed lines represent ± 2 standard deviations (SD) above and below the long-term mean. Red line is the 12-month moving average. The 2015 marine heatwave is represented by the highest SST values over the 120-year time series. Data are from NOAA’s Extended Reconstructed SST v5 (https://www.ncei.noaa.gov/products/land-based-station/noaa-global-temp) and values shown are the 90th percentile of monthly SST from within the vicinity of the main Hawaiian Islands (18.5 to 22.5°N; −160.5 to −154.5°W).

