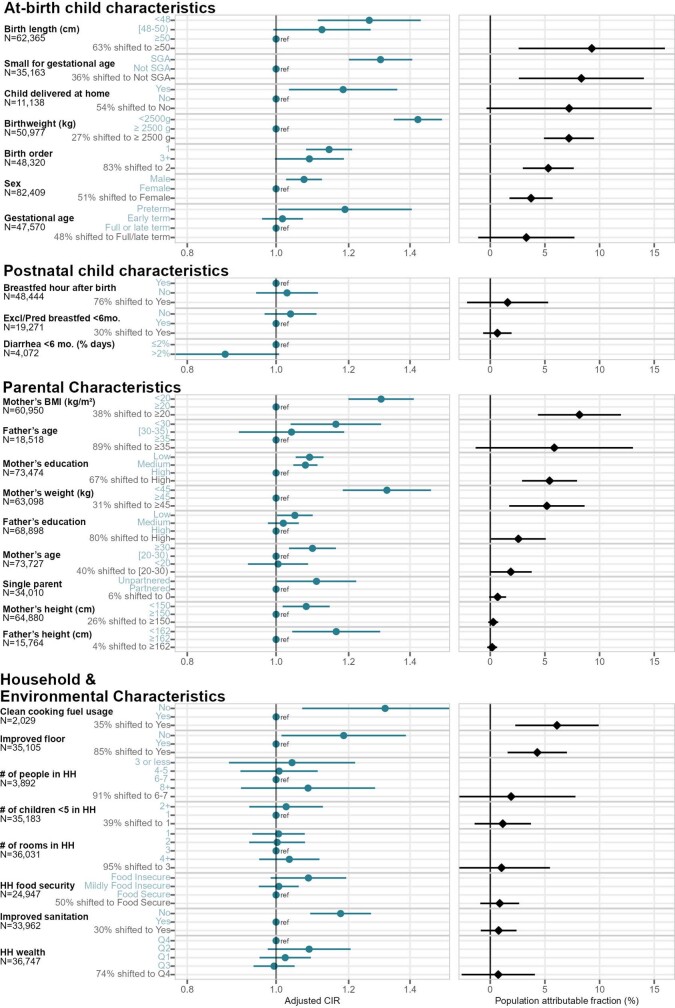
Extended Data Fig. 7. Rank-ordered associations between child, parental, and household characteristics and adjusted relative risks or population attributable fractions of wasting by age 24 months.
Blue points in the left panel show adjusted cumulative incidence ratios (CIRs) between higher-risk exposure levels and reference levels, and black points in the right panel show population attributable fractions (PAFs), the estimated proportion of the risk in the whole population that would be removed if the exposure were set to its indicated reference level. The number of children that contributed to each analysis is listed by exposure. The colored Y-axis label is either the level of exposure contrasted against the reference level to estimate the CIR, or the percent of the population shifted to the lowest-risk level to estimate the PAF. For at-birth exposures, at-birth stunting and wasting were excluded, and for postnatal exposures (breastfeeding practice and diarrheal disease), the cumulative incidence of wasting from 6-24 months was used. Cohort-specific estimates were adjusted for all measured confounders using ensemble machine learning and TMLE, and then pooled using random effects (Methods). Estimates are shown only for exposures measured in at least 4 studies. The PAF for diarrhea under 6 months was not calculable or plotted due to the unexpected CIR <1 for estimated higher diarrheal disease burden.

