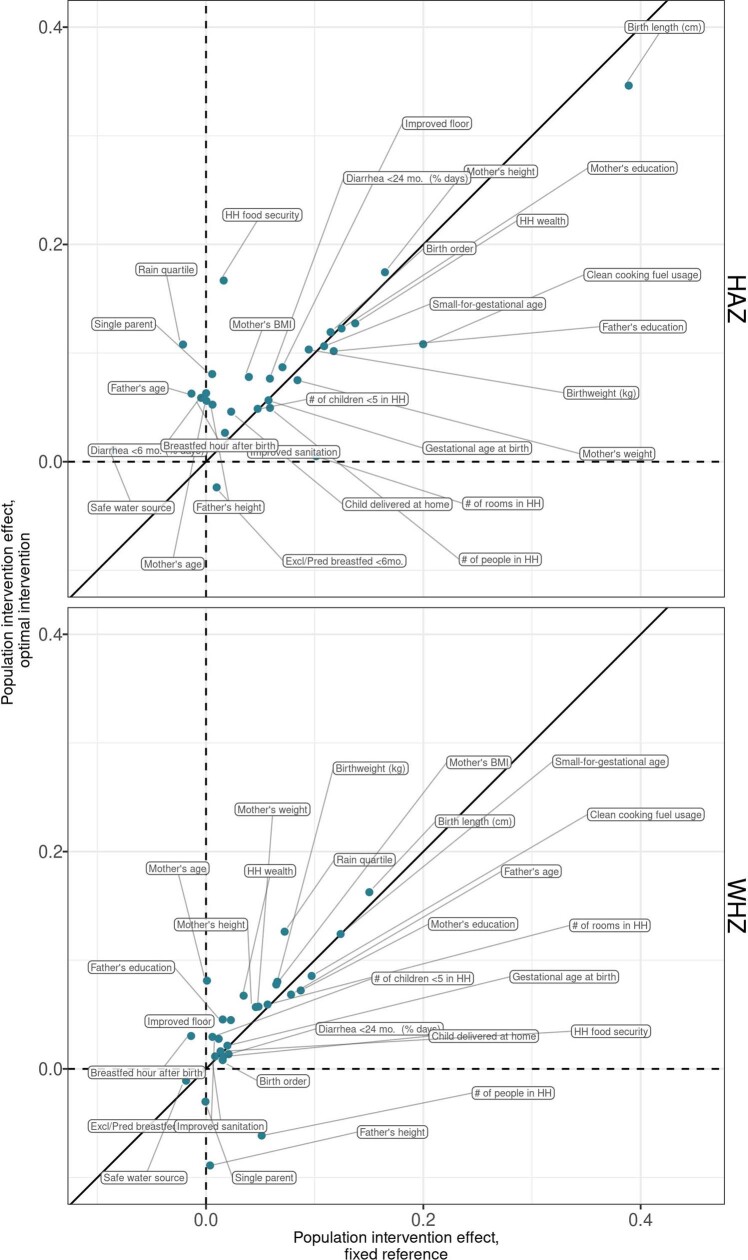
Extended Data Fig. 11. Comparing fixed-reference and optimal intervention estimates of the population intervention effect.
Pooled population intervention effects on child LAZ and WHZ at 24 months, with the X-axis showing attributable differences using a fixed, and the Y-axis showing the optimal intervention attributable difference, where the level the exposure is shifted to can vary by child. Points are labeled with the specific risk factor. Estimates farther from the diagonal line have larger differences between the static and optimal intervention estimates. The optimal intervention attributable differences, which are not estimated with an a-priori specified low-risk reference level, were generally close to the static attributable differences, indicating that the chosen reference levels were the lowest-risk strata in most or all children.

