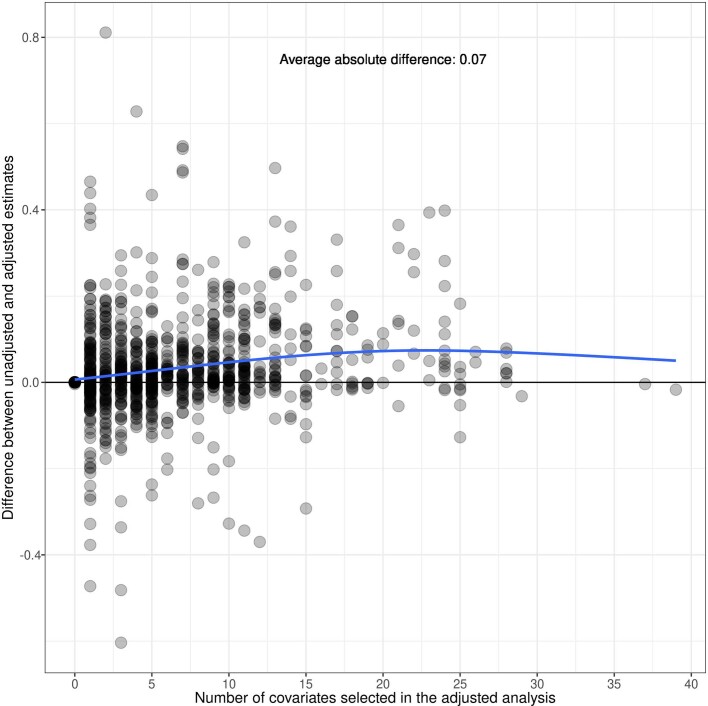
Extended Data Fig. 12. Difference between adjusted and unadjusted Z-score effects by number of selected adjustment variables.
Points mark the difference in estimates unadjusted and adjusted estimates of the difference in average Z-scores between exposed and unexposed children across 33 cohorts, 30 exposures and length-for-age and weight-for-length Z-score outcomes included in the analysis. Different cohorts measured different sets of exposures, and a different number of adjustment covariates were chosen for each cohort-specific estimate based on outcome sparsity, so cohort-specific estimates adjust for different covariates and numbers of covariates. The plot shows no systematic bias between unadjusted and adjusted estimates based on number of covariates chosen. The blue line shows the average difference between adjusted estimates from unadjusted estimates, fitted using a cubic spline.

