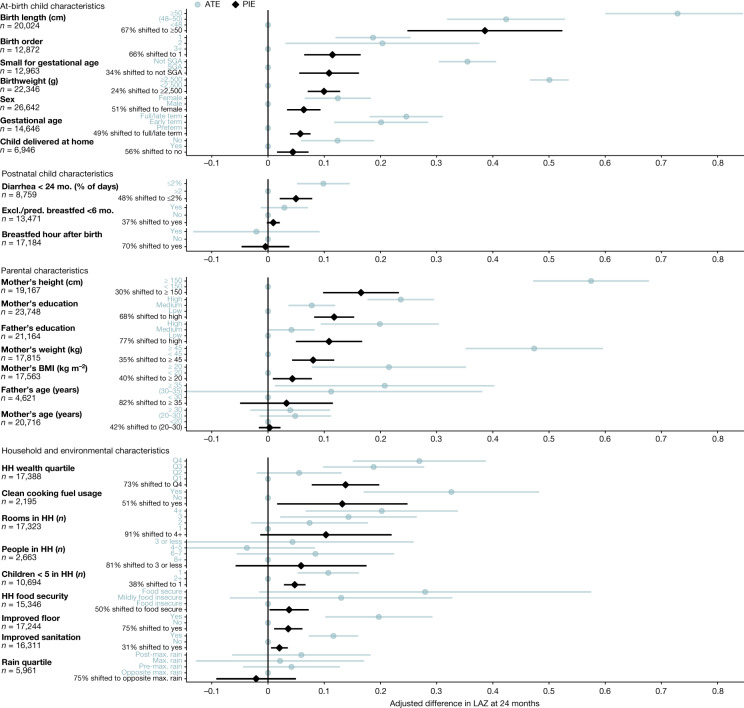
Fig. 2. Population intervention effects and mean differences for child, parental, and household exposures on LAZ at 24 months of age.
Adjusted mean differences in average treatment effects (ATEs) (blue) between the labelled higher-risk level of exposures and the reference level (grey dot on the vertical line), and population intervention effects (PIEs) (black), the estimated difference in LAZ after shifting exposure levels for all children to the reference level. The number of children that contributed to each analysis is listed for each exposure. Labels on the y axis indicate the level of exposure used to estimate the ATE (blue) or the percentage of the population shifted to the lowest-risk level to estimate the PIE (black). Cohort-specific estimates were adjusted for all measured confounders using ensemble machine learning and targeted maximum-likelihood estimation (TMLE) and then pooled using random effects (Methods). Estimates are shown only for exposures measured in at least four cohorts. Max. maximum; Q, quartile; SGA, small for gestational age.

