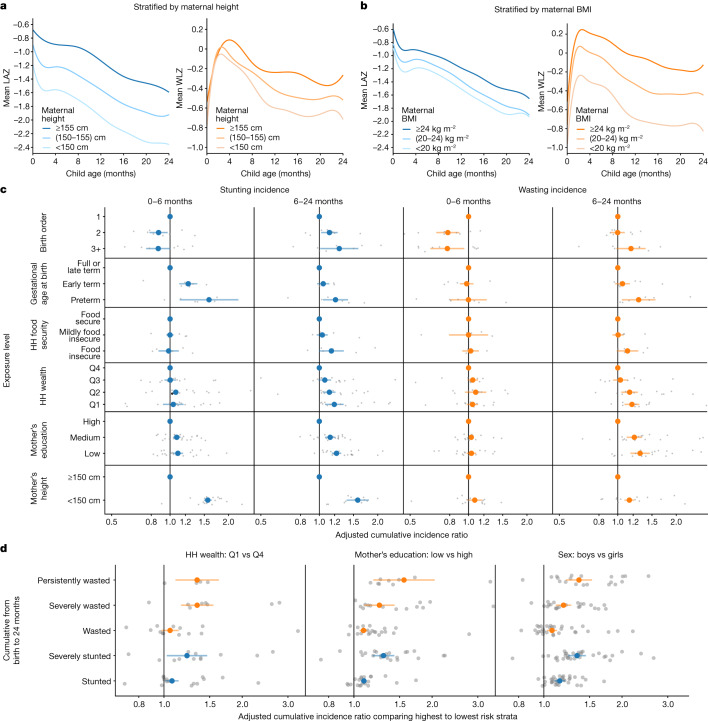
Fig. 4. Effect of key exposures on the trajectories, timing and severity of child growth faltering.
a, Child LAZ and WLZ trajectories stratified by maternal height (n = 413,921 measurements, 65,061 children, 20 studies). b, Child LAZ and WLZ stratified by maternal BMI (n = 373,382 measurements, 61,933 children, 17 studies). Growth trajectories stratified by all other examined risk factors are available in Supplementary Note 5. c, Associations between key exposures and cumulative wasting incidence, stratified by age of the child during wasting incidence. Grey dots indicate cohort-specific estimates. d, Associations between key exposures and growth faltering of different severities. Cumulative incidence ratios compare the highest and lowest-risk categories of each exposure, as indicated above each graph. Grey dots indicate cohort-specific estimates.

