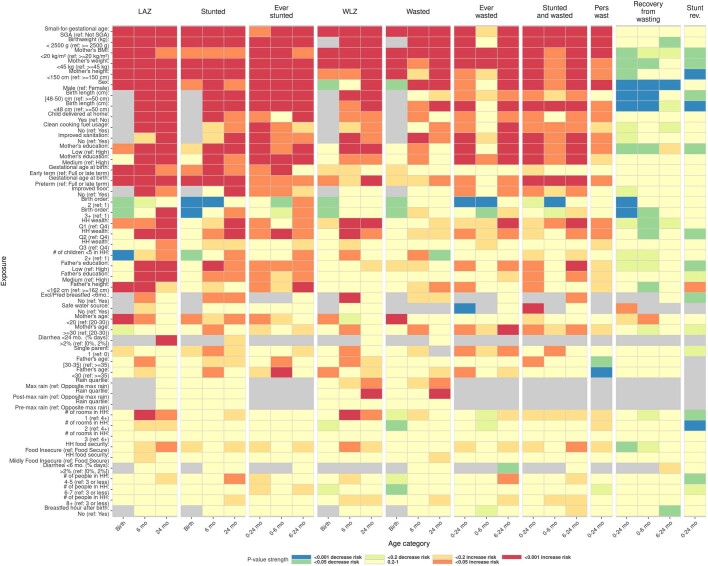
Extended Data Fig. 2. Heatmap of significance and direction across exposure-outcome combinations.
The heatmap shows the significance and direction of estimates through the cell colors, separated across primary outcomes by child age. Red and orange cells are exposures where the outcome is estimated have an increased probability of occurring compared to the reference level (harmful exposures except for recovery outcomes), while blue and green cells are exposures associated with a decreased probability of the outcome (protective exposures except for recovery outcomes). The outcomes are labeled at the top of the columns, with each set of three columns the set of three ages analyzed for that outcome. Each row is a level of an exposure variable, with reference levels excluded. Rows are sorted top to bottom by increasing average p-value. Grey cells denote comparisons that were not estimated or could not be estimated because of data sparsity in the exposure-outcome combination. All point estimates and confidence intervals for exposure-outcome pairs with P-values plotted in this figure are viewable online in Supplimentary Note 7.

