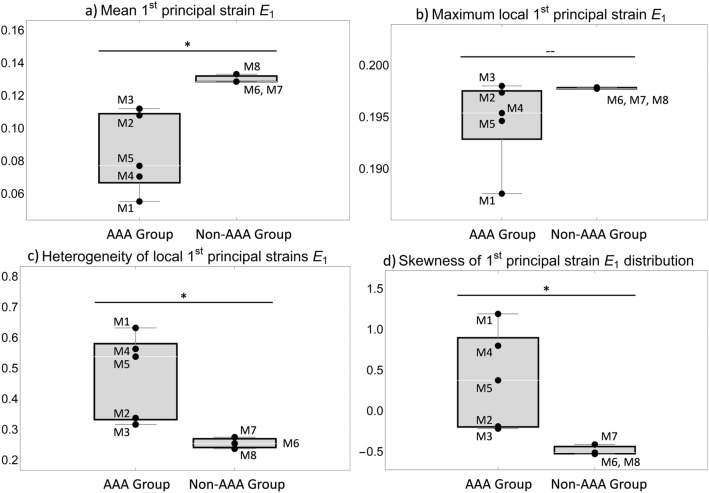
Fig. 3.
Comparison of the indices characterizing the distribution of local principal strain values that were obtained for aneurysmal (“AAA Group”) and non-aneurysmal (“Non-AAA Group”) mouse aortae: a mean, b maximum, c coefficient of variation as measure for heterogeneity and d) skewness. In all cases, a Student’s t-test was performed. * indicates a significant difference between both groups corresponding to and—indicates that no significant difference was observed

