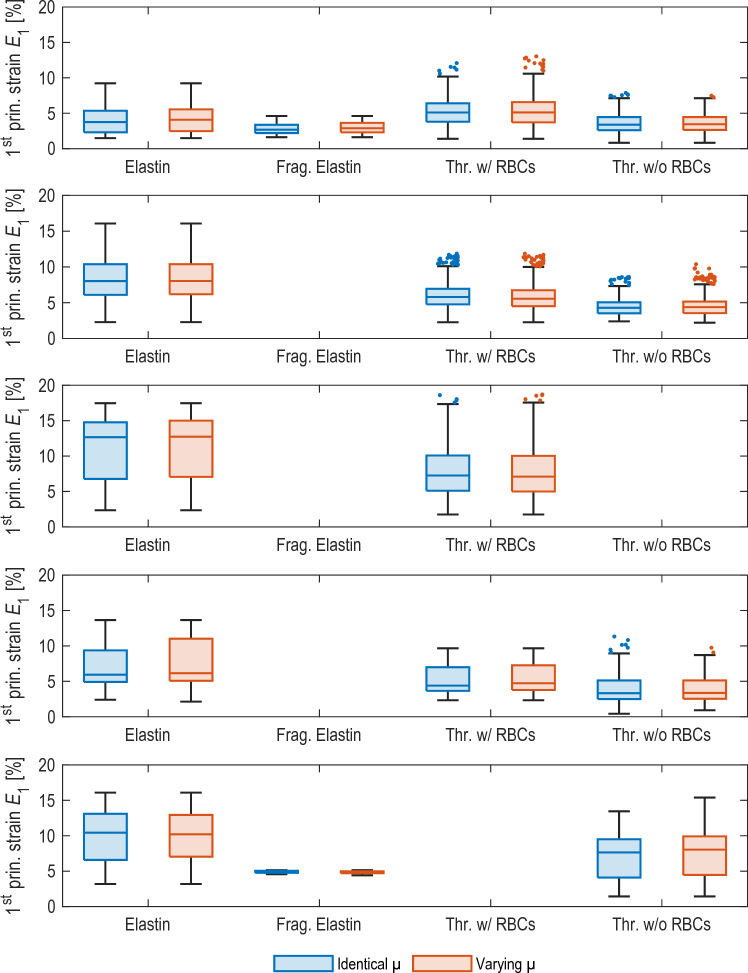
Fig. 8.
Results of the obtained strains for the error estimation of the inner contours. For one of the slices of each of the five mice M1-M5 (row 1 to 5), the simulations were performed with constant material parameter (Identical , blue, left box, respectively) and corresponding tangent stiffnesses for the different tissue regions (Varying , red, right box, respectively). Based on the resulting contours, strains were then isolated and compared using box-whisker plots. The quantified error estimates can be found in Table 1

