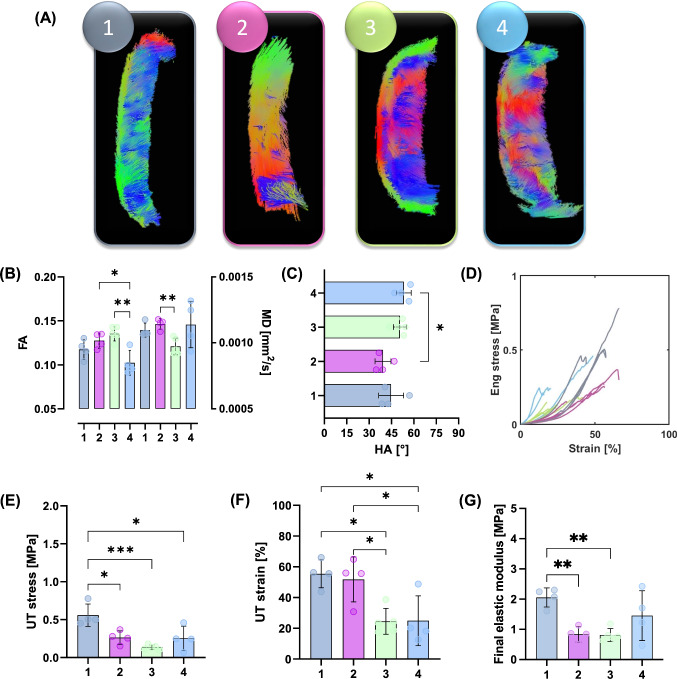
Fig. 6.
Mechanical properties of atherosclerotic plaque strips when informed by DTI-derived tractography. A Representative tractography of strip samples in each group. B FA and MD values within these groups; FA: significance determined by an ordinary one-way ANOVA with Tukey’s post hoc multiple comparisons, **p = 0.0023, *p = 0.0237. MD: significance determined by Brown-Forsythe and Welch ANOVA with Dunnett’s T3 post hoc multiple comparisons, **p = 0.0089. C Mean HA for each group; significance determined by ordinary one-way ANOVA with Tukey’s post hoc multiple comparisons, *p = 0.0227. D Stress–strain curves for n = 17 strips, colour coded by their respective groupings. E UT stress; significance determined by ordinary one-way ANOVA with Tukey’s post hoc multiple comparisons, Group 1 and 2 *p = 0.0138, Group 1 and 3 ***p = 0.0005, and Group 1 and 4 *p = 0.0112. F UT strain; significance determined by an ordinary one-way ANOVA with Tukey’s post hoc multiple comparisons, Group 3 and 2 *p = 0.0225, Group 3 and 1 *p = 0.0145, Group 4 and 2 *p = 0.0255, and Group 4 and 1 *p = 0.0191. G Final elastic modulus; significance determined by Brown-Forsythe and Welch ANOVA with Dunnett’s T3 post hoc multiple comparisons, Group 1 and 2 **p = 0.0051 and Group 1 and 3 **p = 0.0053.

