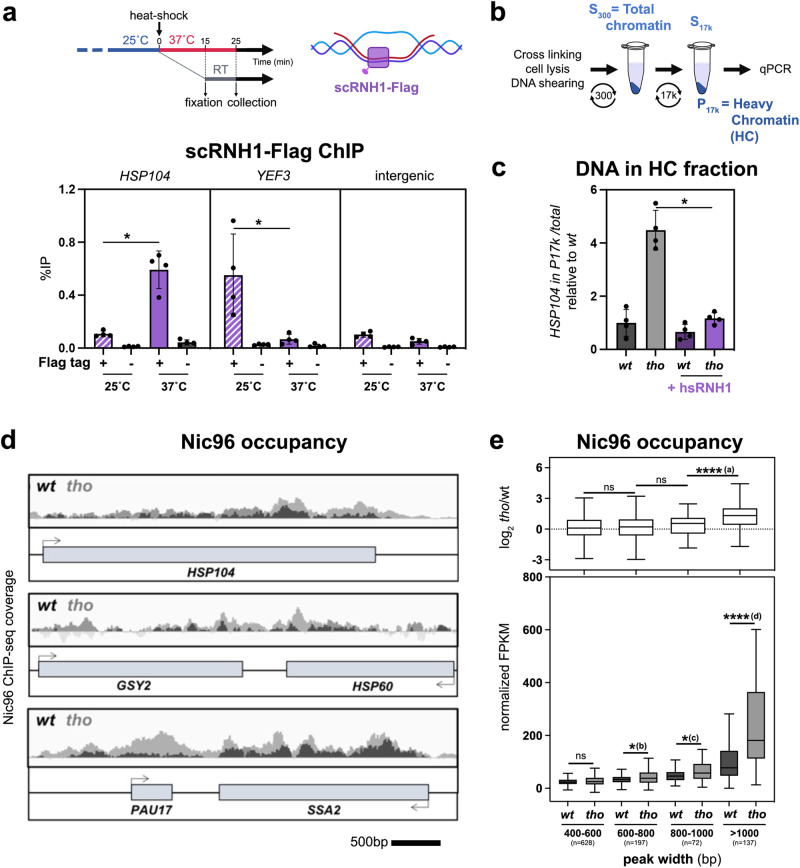
Fig. 2. Stress-induced transcriptional activation leads to R-loop dependent relocation to the NPC.
a Top: timeline of the heat shock and fixation procedure and schematic representation of scRNase H1 binding to the DNA:RNA hybrid within an R-loop; Bottom: scRNase H1-Flag occupancy was analyzed at the indicated loci by ChIP-qPCR in wt cells transformed with either an empty vector, or the tetOFF-scRNH1-Flag construct, and further grown at 25 °C or heat shocked at 37 °C for 15 min (% of immunoprecipitation; mean ± SD, n = 4 independent experiments). Statistical test: two-sided Mann-Whitney-Wilcoxon test; *p = 2.86 × 10⁻². b Principle of the differential chromatin fractionation procedure. The presence of the gene of interest in the pellet (P17k) and supernatant (S17k) fractions is evaluated by qPCR. c qPCR-based quantification of the amount of DNA from the HSP104 locus in heavy chromatin (HC) fractions from wt or tho (mft1∆) mutant cells transformed with either an empty vector or the GPD-hsRNH1 construct (+hsRNH1), and heat shocked at 37 °C for 15 min (% of HSP104 in P17K relative to total [S17K + P17K]; mean ± SD, n = 4 independent experiments, relative to wt). Statistical test: two-sided Mann-Whitney-Wilcoxon test; *p = 2.86 × 10⁻². d Integrative Genomics Viewer (IGV) representative screenshots of Nic96 ChIP-seq coverage in wt or tho (mft1∆) mutant cells heat shocked at 37 °C for 15 min. Scale bar, 500 bp. e Nic96 enrichment (bottom panel, normalized FPKM; top panel, log2 [tho/wt]) in wt or tho mutant cells heat shocked at 37 °C for 15 min. Nic96-bound regions identified through peak calling were categorized according to peak width (bp). The number of regions is indicated for each category. Box-plots are defined as above (Fig. 1d–f). Outliers identified according to Tukey’s definition are not represented on this scale but have been included in statistical analyses. Statistical test: two-sided Mann-Whitney-Wilcoxon test; (a), p < 10−4; (b), p = 3.59 × 10⁻²; (c), p = 1.58 × 10⁻²; (d), p < 10−4. Source data are provided as a Source Data file.

