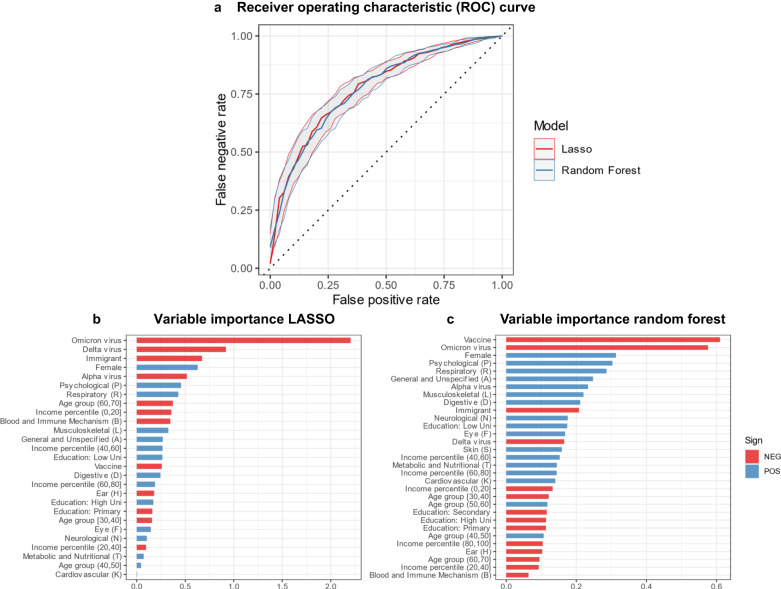
Fig. 2. Results from machine learning models.
Receiver operating characteristic curve (a), and variable importance scores (b, c).The solid lines show the ROC curve for the LASSO and random forest, in red and blue, respectively (a). The shaded areas indicate the 95% confidence intervals. The variable importance scores for the LASSO (b) were based on standardized coefficients, i.e., the beta divided by its standard error. The variable importance scores of the Random Forest were calculated by sequentially randomizing each variable and assess the drop in prediction performance (c). The strongest predictors are those where prediction performance drops the most when replaced with noise. The signs of the predictors in the Random Forest were determined by comparing average sample likelihoods when recoding the predictor in question on/off for all individuals. If the average sample likelihood increased, the sign was coded as “POS”, otherwise “NEG”. There were n = 171,733 individuals in the training set, and n = 42,934 in the test set. Education: LowUni = Education: Lower University degree; Education: HighUni = Education: Higher University degree.

