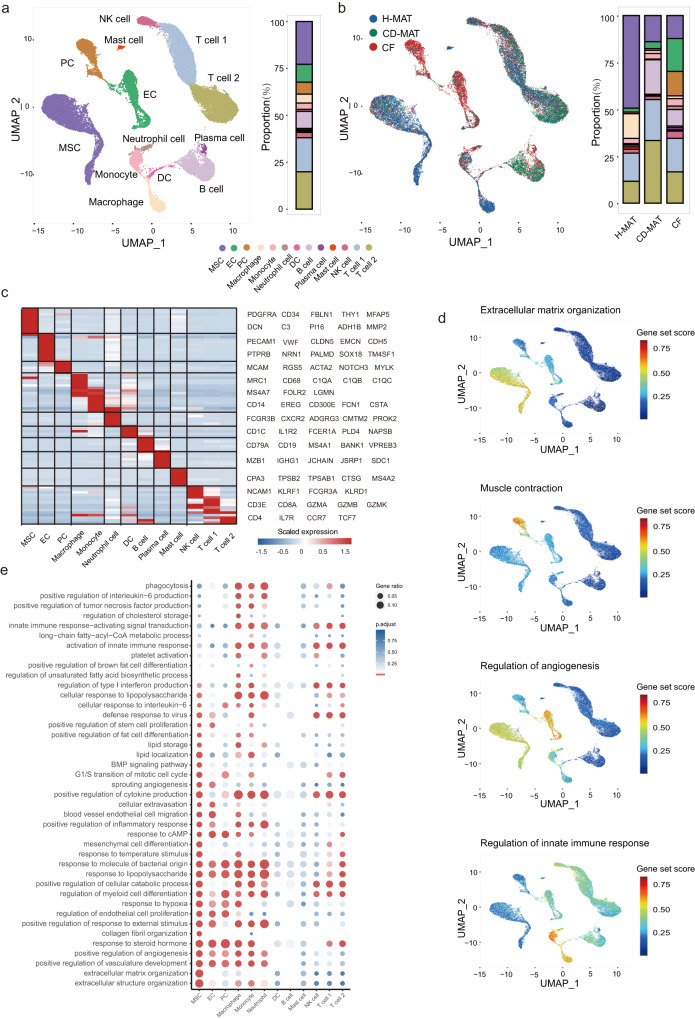
Fig. 2. Compositions and functions of the stromal vascular fractions in human MAT.
a, b scRNA-seq-generated UMAP plots of H-MAT, CD-MAT and CF distinguishing thirteen individual cell clusters (a) and tissue sources (b). Coloured bars indicate the frequency of cell types. c Heatmap showing scaled expression of specific marker genes for thirteen cell clusters. d Individual cell AUC score overlay for selected canonical pathway activities. Colour saturation indicates the gene set score. e scRNA-seq-generated dotplot heatmap showing GO terms enriched in thirteen cell cluster DEGs and p value were determined via two-sided Wilcoxon rank sum test. p < 0.05 was considered to indicate statistical significance.

