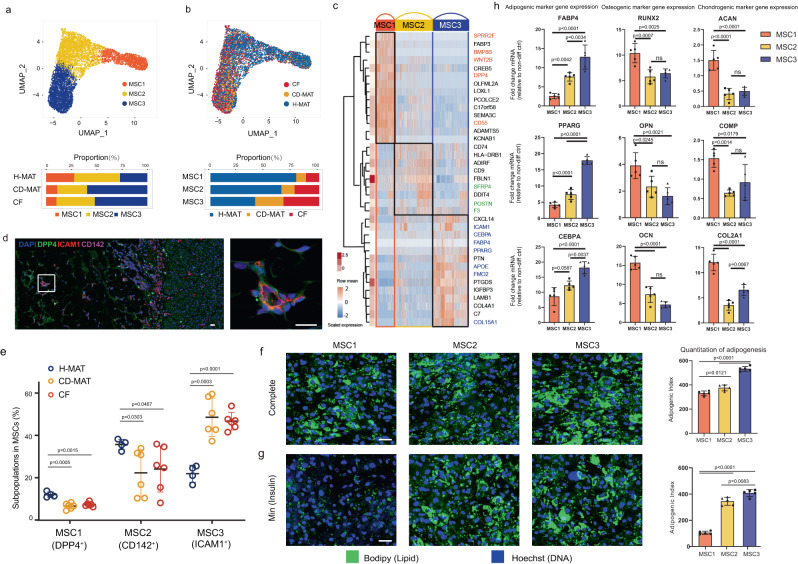
Fig. 3. Characterization of the genomics and function of MSC subpopulations.
a, b scRNA-seq-generated UMAP plots of MSCs distinguishing three individual subpopulations (a) and tissue sources (b). Coloured bars indicate the proportion of MSCs in H-MAT, CD-MAT and CF. c Heatmap (blue-to-red) showing the expression of specific marker genes for three MSCs; hierarchically clustered rows, mean gene expression (white-to-red, left). d Representative immunofluorescence images of DPP4 (green), ICAM1 (red) CD142 (pink) and DAPI (blue) in human MAT. Scale bars, 25 μM. e Flow cytometry showing the percentage of subpopulations in MSCs isolated from H-MAT, CD-MAT and CF of control subjects (n = 4) and CD patients (n = 6). The centre line represents the mean. f, g Microscopy images of human MSC subpopulations after exposure to the complete adipogenic differentiation cocktail (f) or insulin only (Min) (g). [n = 5 biological replicates (BRs) per condition]. Scale bars, 50 μM. h mRNA levels of osteocyte-specific genes and chondrocyte-specific genes in MSC subpopulations exposed to osteogenic or chondrogenic differentiation inducers (representative of 5 BRs per condition). e, f–h The data are presented as means ± s.d. and p value were determined via two-sided one-way ANOVA. Source data are provided as a Source data file.

