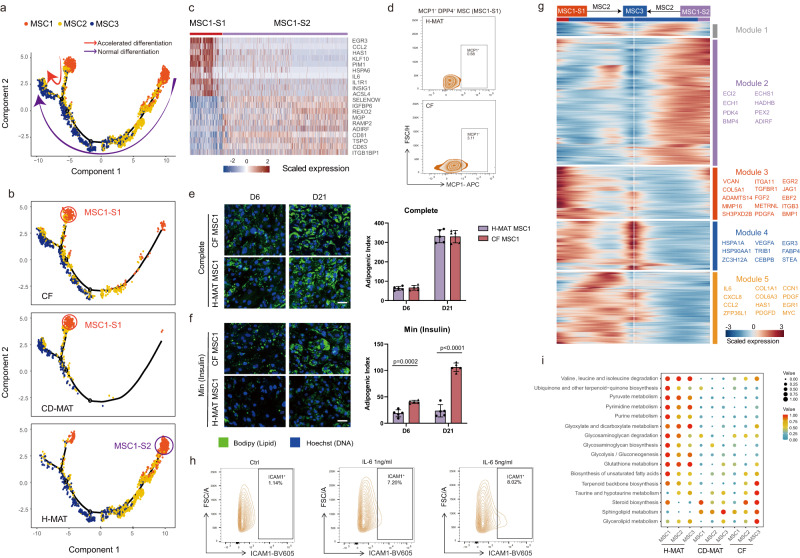
Fig. 4. MSC subpopulations expedite adipogenesis in CF.
a Monocle analysis of MSC subpopulations with gene expression profiles indicating accelerated MSC1 differentiation (red arrow) and normal differentiation (purple arrow) in the developmental trajectory. Each point corresponds to a single cell. Cluster information is shown. b Monocle analysis of the MSC subpopulations showing tissue source classification as H-MAT (bottom), CD-MAT (middle) or CF (top). c Heatmap (red-to-blue) showing the expression of specific marker genes for two MSC1 subsets. d Representative flow cytometry zebra plot of monocyte chemoattractant protein 1 (MCP-1, also known as CCL2) expression on MSC1 cells in H-MAT and CF. e, f Microscopy images of CF-derived and H-MAT-derived MSC1 after exposure to the complete adipogenic differentiation cocktail (e) or insulin only (Min) (f) for 6 days or 21 days of differentiation (representative of 5 BRs per condition). Scale bars, 50 μM. The data are presented as means ± s.d. and p value were determined via two-sided unpaired t-test. g Heatmap with spline curves fitted to genes differentially expressed across MSC1-S2 to MSC3 (right arrow) and MSC1-S1 to MSC3 (left arrow) pseudotemporal trajectories, grouped by hierarchical clustering (k = 5). Gene co-expression modules (colour) and exemplar genes from main modules are labelled (right). h Flow cytometry showing ICAM1 expression in MSC1 cells after stimulation with IL-6 for 12 h. i Metabolic activity analysis of MSC subpopulations from H-MAT, CD-MAT and CF. The circle size and colour darkness both represent the scaled metabolic score. Source data are provided as a Source data file.

