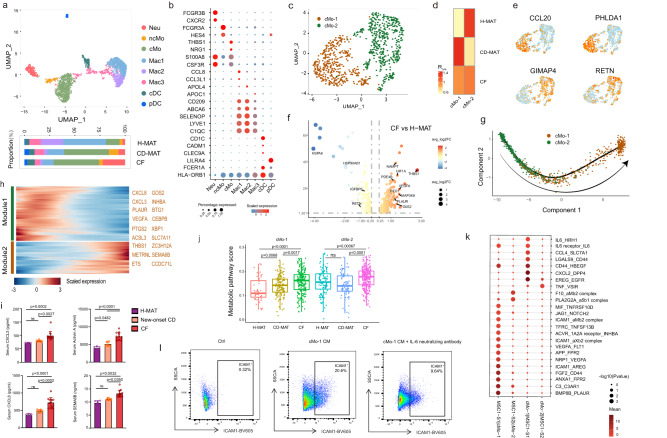
Fig. 5. A distinct monocyte subset accumulates in CF and is pro-inflammatory and pro-adipogenic.
a scRNA-seq-generated UMAP plot of myeloid cells distinguishing eight individual subpopulations. Coloured bars indicate the proportion of myeloid cells in H-MAT, CD-MAT and CF. b Dot plot showing selected top differentially expressed marker genes for eight subpopulations of myeloid cells. Colour saturation indicates the strength of expression in positive cells, while dot size reflects the percentage of each cell cluster expressing the gene. c UMAP plot of monocytes distinguishing two individual subsets. d The proportion of cMo1 and cMo2 of H-MAT, CD-MAT and CF estimated by Ro/e score. e Expression levels of representative marker genes for cMo-1 and cMo-2 are plotted onto the UMAP. f The volcano plot represents the differentially expressed genes of cMo-1 between CF and H-MAT. g Monocle analysis of cMo cells with gene expression profiles indicating pseudotime directionality (arrow). Each point corresponds to a single cell. Cluster information is shown. h The differentially expressed genes (rows) along the pseudotime (columns) are clustered hierarchically into two profiles. Heatmap showing the expression of representative identified genes. Gene co-expression modules (colour) and exemplar genes from module 2 are labelled. i ELISA for CXCL3, Activin A, CXCL8 and SEMA6B detection in serum obtained from blood samples taken from H-MAT (n = 6), new-onset CD (n = 8) or CF (n = 13, from CD patients who underwent surgery for small intestine stenosis and/or obstruction with varying degrees of CF hyperplasia). The data representing mean ± s.d. and p value were generated using one-way ANOVA. j Boxplots comparing the metabolic activity scores of cMo-1 and cMo-2 in H-MAT (n = 2), CD-MAT (n = 3) and CF (n = 6). The centre line represents the median, box hinges represent frst and third quartiles and whiskers represent ± 1.5x interquartile range. k Bubble plots showing ligand–receptor pairs between cMo and MSC1 cells in CD patients and control subjects. The circle size represents the log-normalized P value, whereas the colour represents the log-transformed mean expression of ligand and receptor. l Flow cytometry showing ICAM1 expression in MSC1 cells after co-cultured with cMo-1 culture medium with or without IL-6 neutralizing antibody for 12 h. j, k Data were analysed using two-sided Wilcoxon rank sum test. Source data are provided as a Source data file.

