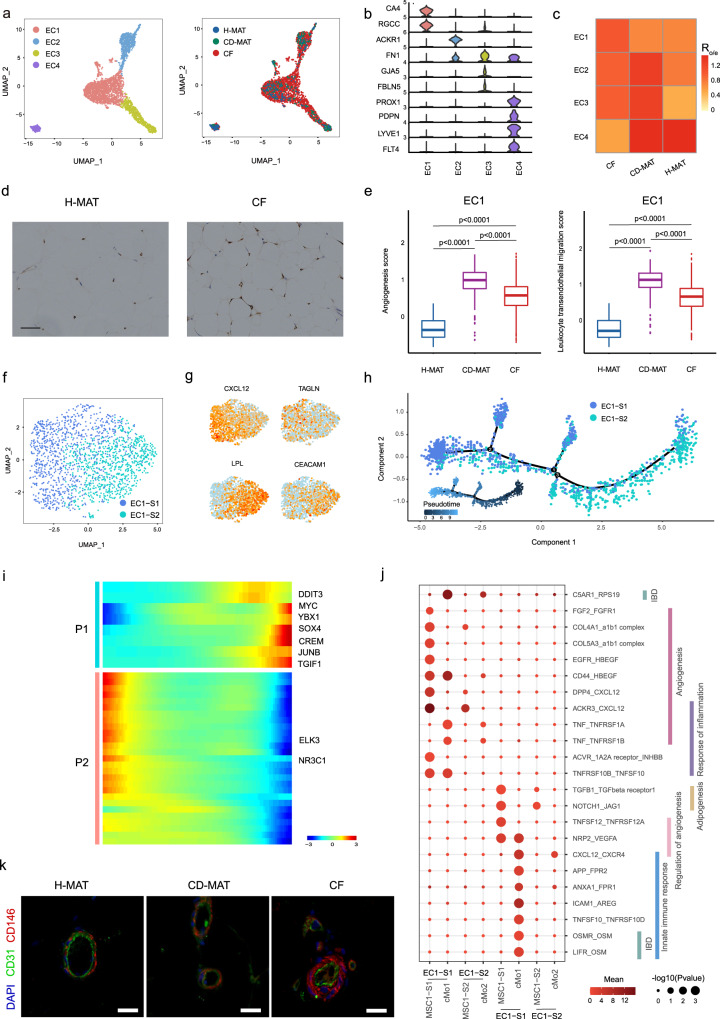
Fig. 6. EC subpopulations inhabit the adipogenic niche.
a scRNA-seq-generated UMAP plots of ECs distinguishing four individual subpopulations (left) and tissue sources (right). b Violin plots displaying the expression of representative well-known marker genes across four EC subpopulations. The y-axis represents log-scaled normalized UMI counts. c The proportion of four EC subpopulations of H-MAT, CD-MAT and CF estimated by Ro/e score. d Immunohistochemical staining of CA4 expression in the H-MAT and CF vasculature (representative of 5 BRs per group). Scale bars, 25 μM. e Boxplots comparing the scores of angiogenesis and leucocyte transendothelial migration in EC1 of H-MAT (n = 2), CD-MAT (n = 3) and CF (n = 6). The centre line represents the median, box hinges represent frst and third quartiles and whiskers represent ± 1.5x interquartile range. f UMAP plot of EC1 distinguishing two individual subsets. g Expression levels of representative marker genes for EC1-S1 and EC1-S2 are plotted onto the UMAP. h Monocle analysis of the EC1 subsets indicating pseudotime directionality (bottom left) and cell type; EC1-S1 (blue) and EC1-S2 (cyan). i The differentially expressed genes (rows) along the pseudotime (columns) are clustered hierarchically into two profiles. Heatmap showing the expression of representative TFs in two profiles across single cells. j Bubble plots showing ligand–receptor pairs between EC1s and other cell groups in CD patients and control subjects. The circle size represents the log-normalized P value, whereas the colour represents the log-transformed mean expression of ligand and receptor. k Immunofluorescence confirmed the existence and distribution of pericytes in H-MAT, CD-MAT and CF (representative of 5 BRs per group). Scale bars, 50 μM. e, j Data were analysed using two-sided Wilcoxon rank sum test. Source data are provided as a Source data file.

