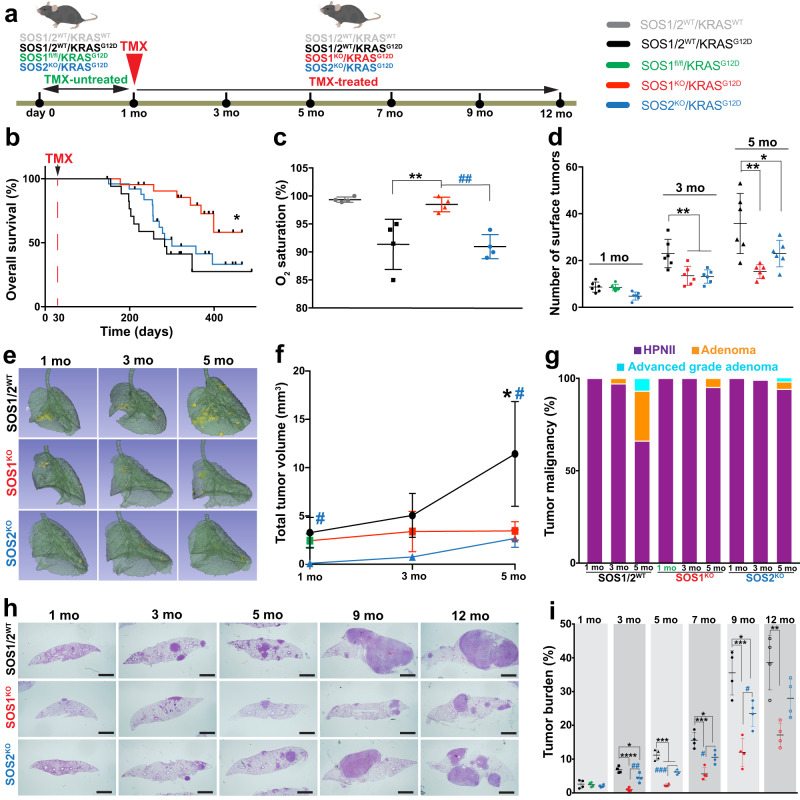
Fig. 1. SOS1/2 genetic ablation protects from KRASG12D-driven LUAD in mice.
a Schematic illustration of the experimental strategy applied to all different genotypic groups. Animals of the indicated KRAS and SOS1/2 genotypes were equally treated with TMX after 1 month of age and then analyzed during the ensuing months at the timepoints indicated in the following panels. b Kaplan–Meier survival plots for SOS1/2WT (black), SOS1KO (red) and SOS2KO (blue) animals analyzed in our model of RASG12D-driven LUAD. n = 20 (SOS1/2WT), n = 25 (SOS1KO), n = 28 (SOS2KO); *P = 0.0107 vs SOS1/2WT. Log-rank (Mantel-Cox) test. c Percentage of O2 saturation in blood of 12-month-old SOS1/2WT/KRASWT and KRASG12D mice of the SOS1/2 genotypes. n = 4 independent mice per genotype. **P = 0.0097 vs SOS1/2WT/KRASG12D; ##P = 0.0068 vs SOS2KO. Data shown as mean ± SD. One-way ANOVA and Tukey’s test. d Total number of KRASG12D-mutant tumors present on the surface of the lungs of 1, 3, and 5 months-old SOS1/2WT, SOS1KO, or SOS2KO mice. n = 6 independent mice per genotype. Data shown as mean ± SD. At 3 months: **P = 0.0067 vs SOS1KO and **P = 0.0052 vs SOS2KO; at 5 months: **P = 0.0018 vs SOS1KO and *P = 0.0424 vs SOS2KO). One-way ANOVA and Tukey’s test. e Representative lung microCT scan images for each age and genotype. f Progression of LUAD tumor volume in the groups and timepoints indicated. n = 3 independent mice per genotype. Data expressed as mean ± SD. At 1 month: #P = 0.0201 vs SOS1KO and P = 0.0052 vs SOS2KO; at 5 months: *P = 0.0382 vs SOS1KO and #P = 0.0264 vs SOS2KO). One-way ANOVA and Tukey’s test. g Percentage distribution of the histopathological grades exhibited by KRASG12D lung tumors of the indicated genotypes and timepoints. Hyperproliferating Type II Pneumocytes (HPNII, black bars), adenoma (orange bars) or advanced grade adenoma (light blue bars). h, i KRASG12D-driven tumor progression examined in lungs of 1 to 12-month-old KRASG12D-mutant mice of the indicated genotypes. h Representative H&E-stained sections of lungs from animals of the indicated age and genotype. Scale bars, 1 mm. i Kinetics of tumor burden progression from 1-month-old to 12-month-old mice of the indicated genotypes. n = 4 independent mice per genotype and timepoint. Data shown as mean ± SD. At 3 months: *P = 0.0176 vs SOS2KO; ****P < 0.0001 vs SOS1KO and ##P = 0.0019 vs SOS2KO; at 5 months: ***P ≤ 0.001 vs SOS1KO and SOS2KO and ###P = 0.0008 vs SOS2KO; at 7 months: ***P = 0.0002 vs SOS1KO and *P = 0.0164 vs SOS2KO and #P = 0.0195 vs SOS2KO; at 9 months: ***P = 0.0002 vs SOS1KO and *P = 0.0195 vs SOS2KO and #P = 0.0243 vs SOS2KO; at 12 months: **P = 0.0019 vs SOS1KO. One-way ANOVA and Tukey’s test. Source data are provided as a Source data file.

