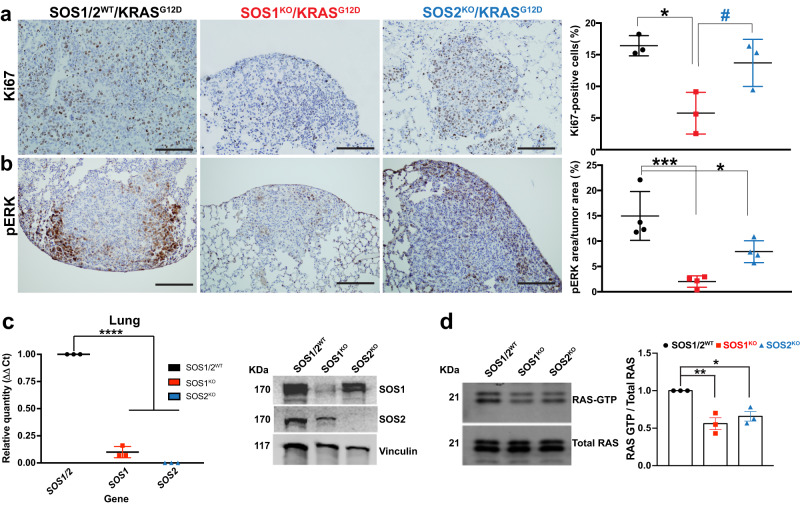
Fig. 2. SOS1 depletion reduces cell proliferation and ERK phosphorylation rates in KRASG12D lung tumors.
a, b Representative images of paraffin-embedded sections from lungs of 5-month-old, KRASG12D-mutant mice of the indicated SOS genotypes (SOS1/2WT, SOS1KO, and SOS2KO) after immunostaining against Ki67 (a) and pERK (b). The bar charts on the right side quantitate the percentage of Ki67-positive cells relative to total number of cells in the tumors (a) and the percentage of pERK-stained area in the tumor relative to total tumor area (b) in the samples. Scale bars, 100 μm. n = 3 independent mice per genotype in (a) and n = 4 independent mice per genotype in (b). Data expressed as mean ± SD; * vs SOS1/2WT; # vs SOS1KO. In (a) (*P = 0.0117 and #P = 0.0412) and in (b) (***P = 0.0006 and *P = 0.0266). One-way ANOVA and Tukey’s test. c SOS1 and SOS2 expression levels in lung tumors isolated from TMX-treated animals of the relevant SOS genotypes (SOS1/2WT, SOS1KO, SOS2KO). Left: mRNA quantification by means of RT-qPCR analysis using β-2-microglobulin as internal control for normalization. Right: Representative Western blots of SOS1 and SOS2 protein expression using vinculin as internal control for normalization. n = 3 independent samples per genotype. Data shown as mean ± SD. ****P < 0.0001 vs SOS1/2WT. One-way ANOVA and Tukey’s test. d Representative RAS-GTP assays and corresponding quantitative densitometric analyses performed in KRASG12D-lung tumors of 5-month-old, TMX-treated SOS1/2WT and SOS1/2-deficient mice. n = 3 independent samples per genotype. Data shown as mean ± SD. *P = 0.0146 and **P = 0.0044 vs SOS1/2WT. One-way ANOVA and Tukey’s test. Source data are provided as a Source data file.

