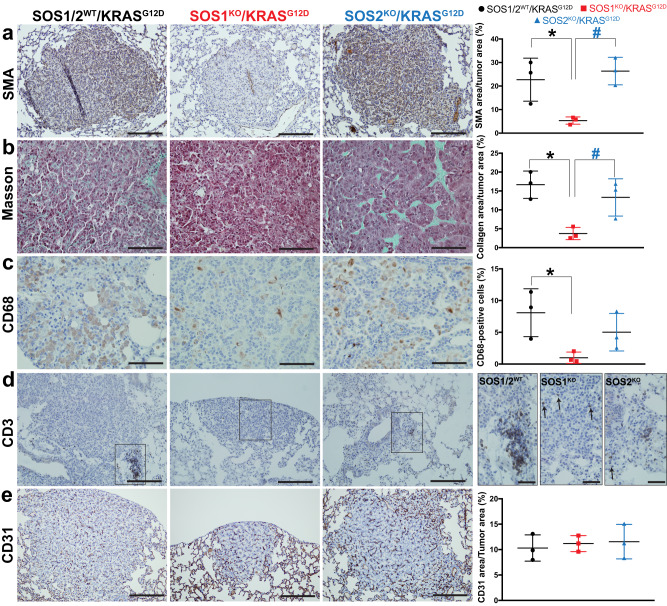
Fig. 3. SOS1 depletion modulates the tumor microenvironment in KRASG12D-driven LUAD.
a–e Representative images of paraffin-embedded sections from KRASG12D-driven lung tumors extracted from 5-month-old, SOS1/2WT, SOS1KO, and SOS2KO mice after immunolabeling for SMA (a), CD68 (c), CD3 (d), and CD31 (e), or staining with Masson trichrome (b), as indicated. Scale bars: a, d, e 100 μm; b, c 50 μm; d inserts, 50 μm. Bar charts on the right side represent the percentage of total tumor area that was specifically stained for SMA (a), collagen (b), and CD31 (e) or the percentage of total tumor cells that were immunopositive for CD68 (c) in lungs of the indicated genotypes. n = 3 independent mice per genotype. Data shown as mean ± SD. *P < 0.05 vs SOS1/2WT; #P < 0.05 vs SOS1KO. In (a): *P = 0.035 and #P = 0.0146. In (b): *P = 0.0107 and #P = 0.0404. In (c): *P = 0.0488. One-way ANOVA and Tukey’s test. Source data are provided as a Source data file.

