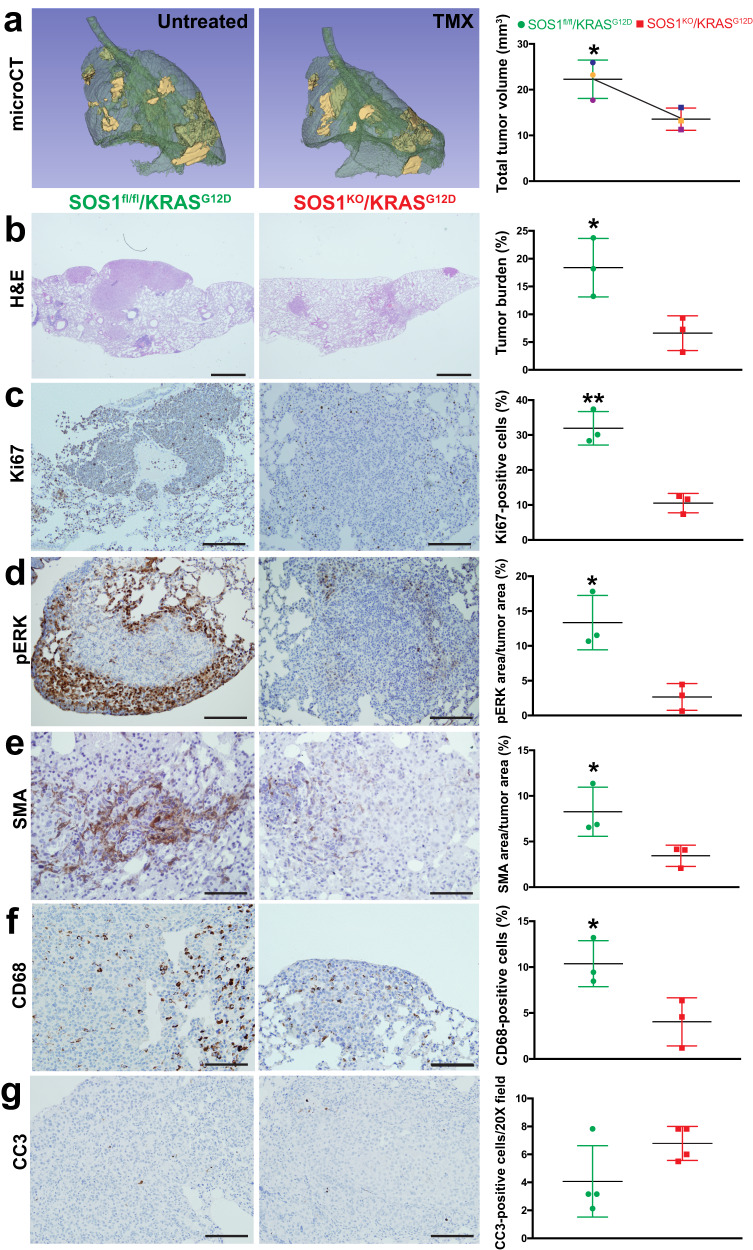
Fig. 4. Impact of SOS1 ablation on preexisting KRASG12D-driven lung tumors.
a Representative microCT scanning image of the lungs of a TMX-untreated 4-month-old SOS1fl/fl/KRASG12D mouse (left) and the lungs of the same animal (right) after two additional months (6-month-old) of TMX treatment. The graph data points corresponding to each individual mouse are identified by a distinctive color in each case. b–g Representative images of paraffin-embedded sections from the lungs of 6-month-old mice (SOS1fl/fl/KRASG12D, TMX-untreated, left side) and comparable counterpart lungs samples from 6-month-old mice treated with TMX for a two-months period (starting treatment at 4 months of age) that were stained with H&E (b) or immunostained for Ki67 (c), pERK (d), SMA (e), CD68 (f) and cleaved-caspase 3 CC3 (g) as indicated. Scale bars: b, 1 mm; c, d, g 100 μm; e, f 200 μm. n = 3 independent mice per genotype and experimental condition. The bar charts on the right side depict quantitative comparisons between the images on the left side pictures (green bars: lungs of TMX-untreated mice; red bars: lungs of TMX-treated mice for 2 months) and represent, respectively, the percentage of lung tumor volume (a), the percentage of lung tumor burden (b), the percentage of Ki67-positive cells in the tumor (c), the percentage of total lung tumor area that was immunostained for pERK (d) or for SMA (e), or the percentage of CD68-positive cells (f) and CC3-positive cells per 20X microscopy field (g). n = 3 independent mice per genotype and experimental condition. Data shown as mean ± SD. *P < 0.05 vs SOS1KO; **P < 0.01 vs SOS1KO. Two-tailed paired t-test was used for statistical analysis in panel a (P = 0.0173), whereas two-tailed unpaired t-test was employed to analyze the comparisons in panels (b–g) (b: P = 0.0289; c: P = 0.0026; d: P = 0.0132; e: P = 0.0466; f: P = 0.0389). Source data are provided as a Source data file.

