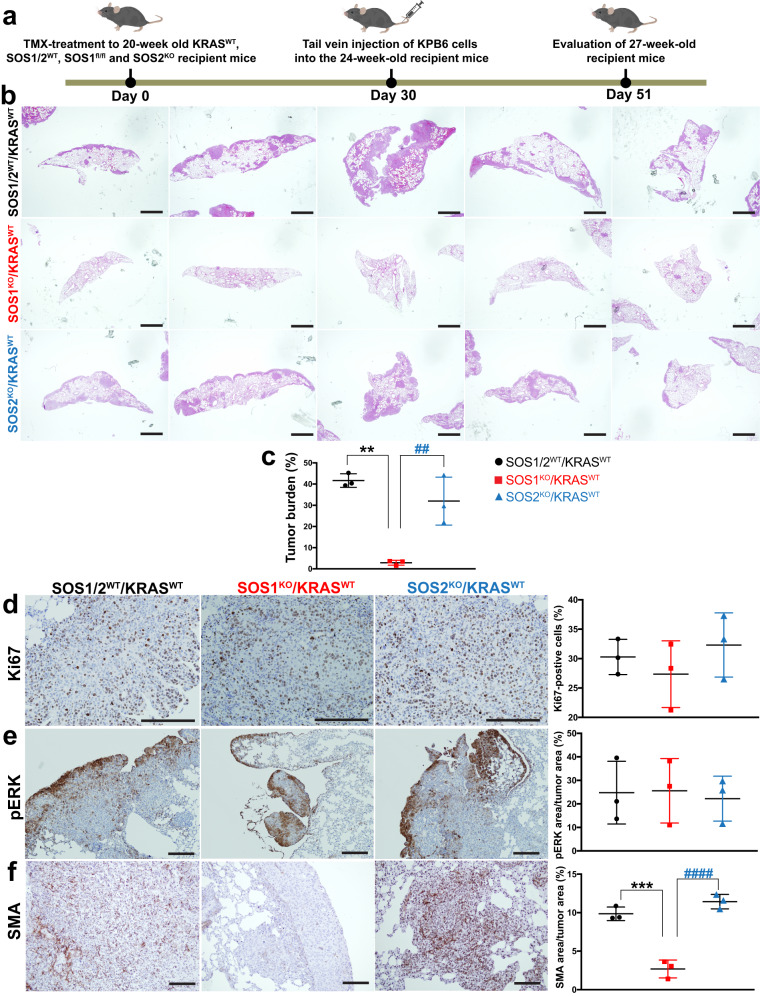
Fig. 5. Nesting and progression of KPB6 lung tumor cells in the lungs of syngeneic mice devoid of SOS1 or SOS2.
a Schematic illustration of the experimental regime and timing of tail vein injection of native KPB6 cells into mice of the indicated genotypes. b Representative images of H&E-stained, paraffin-embedded sections from the 5 different lobes of the lungs of TMX-treated (starting 1 month earlier), 27-week-old, KRASWT, SOS1/2WT, SOS1KO, and SOS2KO. c Bar graph quantifying the total lung tumor burden measured in each of the three experimental groups analyzed. d–f Representative images of paraffin-embedded sections from the lungs of 27-week-old, KRASWT, SOS1/2WT, SOS1KO, and SOS2KO after immunolabeling for Ki67 (d), pERK (e), and SMA (f). Scale bars: b, 1 mm; d–f, 100 μm. The bar graphs on the right side depict the percentage of Ki67-positive cells (d) in the lung tumor, as well as the percentage of total tumor area that was positively immunostained for pERK (e) or SMA (f). n = 3 independent experiments per genotype. Data shown as mean ± SD. * vs SOS1/2WT and # vs SOS2KO. In (c): **P = 0.0011 and ##P = 0.0048. In (f): ***P = 0.0003 and ####P < 0.0001. One-way ANOVA and Tukey’s test Source data are provided as a Source data file.

