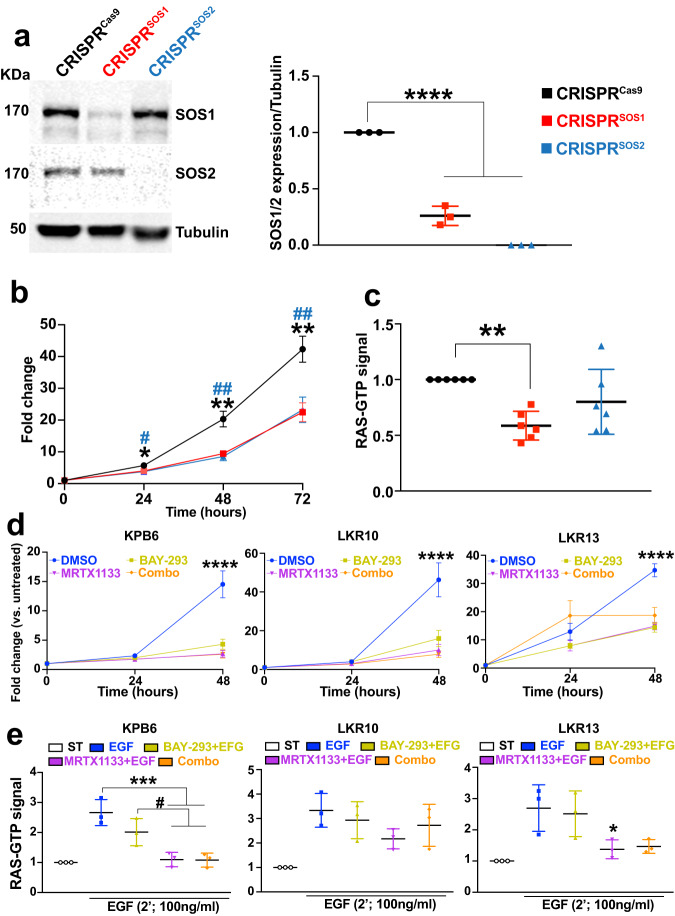
Fig. 7. Effects of CRISPR-mediated SOS1 or SOS2 depletion in KPB6 cells.
a Representative WB images of lysates from KPB6 control cells expressing Cas9 (CRISPRCas9) and from derived, SOS1-silenced (CRISPRSOS1) and SOS2-silenced (CRISPRSOS2) cells, immunolabelled for SOS1, SOS2 or tubulin. The bar graph quantitates the relative expression level of SOS1 or SOS2 normalized to that of tubulin in each case. n = 3 independent samples per group. Data shown as mean ± SD. ****P < 0.0001 vs CRISPRSOS1/2-depleted KPB6 cells. One-way ANOVA and Tukey’s test. b Graph displaying growth curve of KPB6 cell cultures at 24, 48, and 72 h upon CRISPR-induced SOS1 or SOS2 ablation. n = 12 independent samples for CRISPRCas9 and n = 8 independent samples for CRISPRSOS1/2 groups. Data shown as mean ± SD. One-way ANOVA and Tukey’s test. At 24 h (*P = 0.00379 vs CRISPRSOS1 and #P = 0.00241 vs CRISPRSOS2); at 48 h (**P = 0.0020 vs CRISPRSOS1 and ##P = 0.0013 vs CRISPRSOS2) and at 72 h (**P = 0.0022 vs CRISPRSOS1 and ##P = 0.0078 vs CRISPRSOS2). c Relative levels of RAS-GTP in cellular extracts from steady-state cultures of KPB6 cells upon CRISPR-mediated SOS1 or SOS2 depletion. n = 6 independent samples per group. Data shown as mean ± SD. **P = 0.0038 vs CRISPRSOS1. One-way ANOVA and Tukey’s test. d Proliferative rates of cultures of the indicated KRASG12D-mutated cell lines upon treatment with DMSO (vehicle), BAY-293, MRTX1133 or combo (BAY-293 + MRTX1133) for the times indicated. n = 5 independent samples per group. Data shown as mean ± SD. ****P < 0.0001 vs drug-treated cells. One-way ANOVA and Tukey’s test. e Relative levels of RAS-GTP in extracts from serum-starved cultures of the indicated cell lines (white boxes) as well as EGF-stimulated cultures of the same cell lines after undergoing pretreatment with solvent vehicle (blue) or the indicated drugs, singly or in combination. n = 3 independent samples per group. Data shown as mean ± SD. *P < 0.05 (P = 0.0498 in LKR13 cells) or ***P < 0.001 (in KPB6 cells, P = 0.0009 and P = 0.0008, for MRTX + EGF or combo-treated groups, respectively) vs vehicle-treated, EGF-stimulated group, and #P < 0.05 (P = 0.0354 and P = 0.0316, for MRTX + EGF or combo-treated groups, respectively) vs BAY293 + EGF group. One-way ANOVA and Tukey’s test. Source data are provided as a Source data file.

